- Beyond intuition: Using quantitative portfolio models for successful VC fundraising
- Institutionalizing an investment strategy requires quantitative analysis
- The value of scenario modeling for GPs and LPs
- Deploying purpose-built fund forecasting with technology
- Bringing it to life: Insights from quantitative portfolio modeling
- Key portfolio levers that can drive performance divergence
- 1. Risk profile: investment stages
- 2. Number of investments: Shots on goal vs. high conviction
- 3. Ownership in companies: initial and reserve check sizing
The modern venture capital landscape is defined by increased competition and operational complexity. While launching a new fund may be simpler than ever, the process of scaling, managing risk, and achieving long-term, predictable success requires a systematic and quantitative approach.
This article was written in collaboration with Olga Serhiyevich, Founder of Lynx Point.
Institutionalizing an investment strategy requires quantitative analysis
For many investment firms, the discussion of building proprietary tools often focuses on automating lower-leverage tasks, such as generating investment memos. However, a critical gap often remains in the lack of a functional portfolio construction model.
True institutional strength is established when investors transition from relying solely on intuition to quantitatively understanding and forecasting the specific drivers of their fund’s performance.
This shift centers on the practice of portfolio management, a core discipline of successful investing. Portfolio management encompasses a set of critical, interwoven decisions that define a fund’s trajectory. They include:
Capital allocation: Determining optimal deployment across vintage, stage, and sector.
Deal structuring: Managing ownership targets and terms.
Liquidity and risk management: Assessing exposure and potential concentration risks.
Value creation: Modeling the impact of revenue growth, operational improvements, or financial engineering.
Pacing and exit timing: Forecasting deployment and liquidation schedules, including partial sales.
Regardless of a fund’s thesis or strategy, a robust portfolio construction model is essential to consistently execute the strategy, facilitate continuous learning, and provide empirical evidence of performance drivers.
The value of scenario modeling for GPs and LPs
Fund managers, who act as general partners (GPs), regularly engage with the complexities of portfolio management. The process of scenario modeling provides essential clarity and is a core component of institutional due diligence.
The inherent value of modeling is not simply in generating an answer, but in the rigor of the process:
Establishing and testing core assumptions
Quantifying uncertainty and assigning probabilities to outcomes
Modeling diverse market scenarios
Incorporating contradictory evidence to stress-test the thesis
This analytical discipline enables investors to forge robust frameworks for navigating market ambiguity. It develops a nuanced, data-driven understanding of the variables that genuinely influence fund outcomes.
Portfolio models are naturally built on assumptions, including graduation rates, timing, exit sizes, and forward-looking sector dynamics informed by historical patterns. For both established and emerging managers, the ability to fluently develop and utilize these quantitative models significantly increases the depth of thoughtfulness in investment decision-making.
For emerging managers, a clear, robust portfolio construction model provides quantitative evidence for an investment strategy and fund pitch where track records may be limited or less relevant. For all managers, this analytical capability serves as a key differentiator in evaluation by limited partners (LPs).
Deploying purpose-built fund forecasting with technology
In environments where fund outcomes are highly sensitive to continuously shifting variables, purpose-built technology often delivers greater reliability and robustness than custom, in-house solutions.
This is why a platform like Fund Forecasting from Carta is utilized by GPs. It provides the essential clarity and quantitative insight required for complex portfolio construction and fund modeling decisions, bolstered by robust data to guide the key assumptions used in models that can meaningfully impact the portfolio return profile. This ultimately allows fund managers to focus on strategy execution while relying on dedicated technology for sophisticated modeling.
Bringing it to life: Insights from quantitative portfolio modeling
The modeling process translates high-level strategic choices into tangible financial outcomes. For instance, consider four similar $50M early-stage funds that adopt slightly different portfolio construction strategies utilizing the following portfolio construction levers:
Strategy allocation (to different investment stages)
Number of initial investments, and
Reserve allocations.
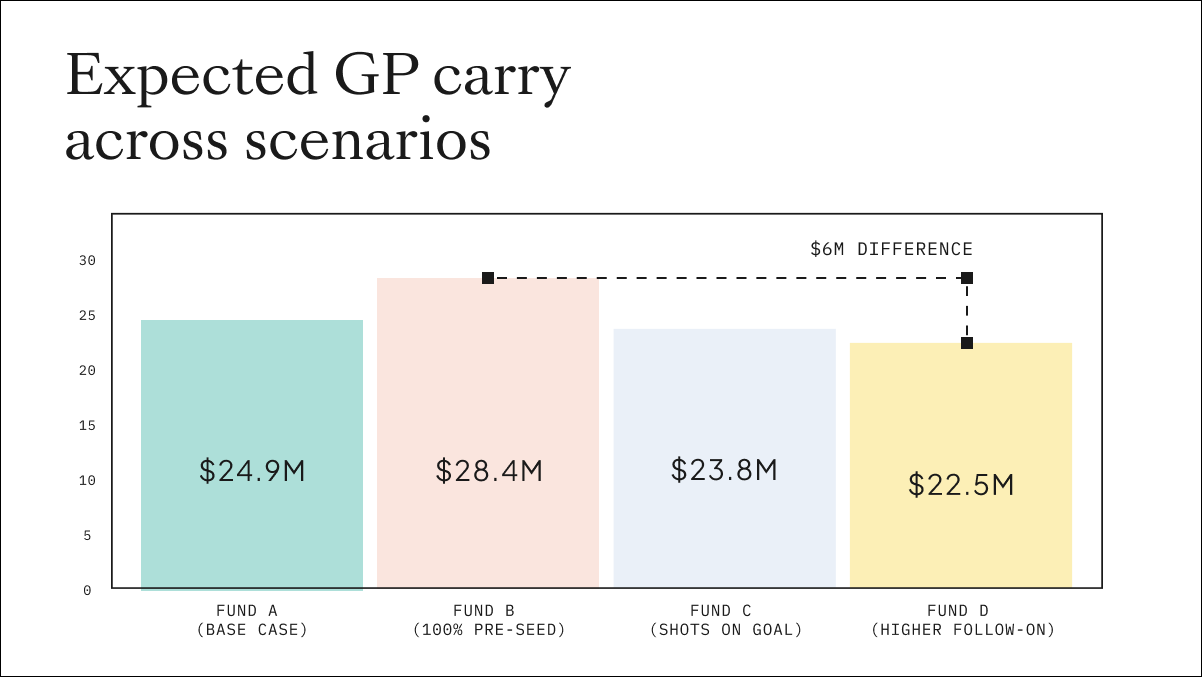
Using Carta’s Fund Forecasting software, we can compare the impact these different portfolio construction decisions can have on overall projected returns. For this analysis, Fund A is our base case scenario, and Funds B, C, and D each showcase a deviation from the base case for one of the portfolio construction levers. Fund B is a riskier strategy with a higher allocation to pre-seed investments, Fund C is a higher “shots on goal” strategy with more, smaller initial checks, and Fund D is a higher reserve strategy for follow-on investments.
(This presentation is provided for illustrative and educational purposes only. All data, figures, projections, and language contained herein are placeholder content and do not represent actual performance, results, or offerings of any fund, investment vehicle, or entity.)
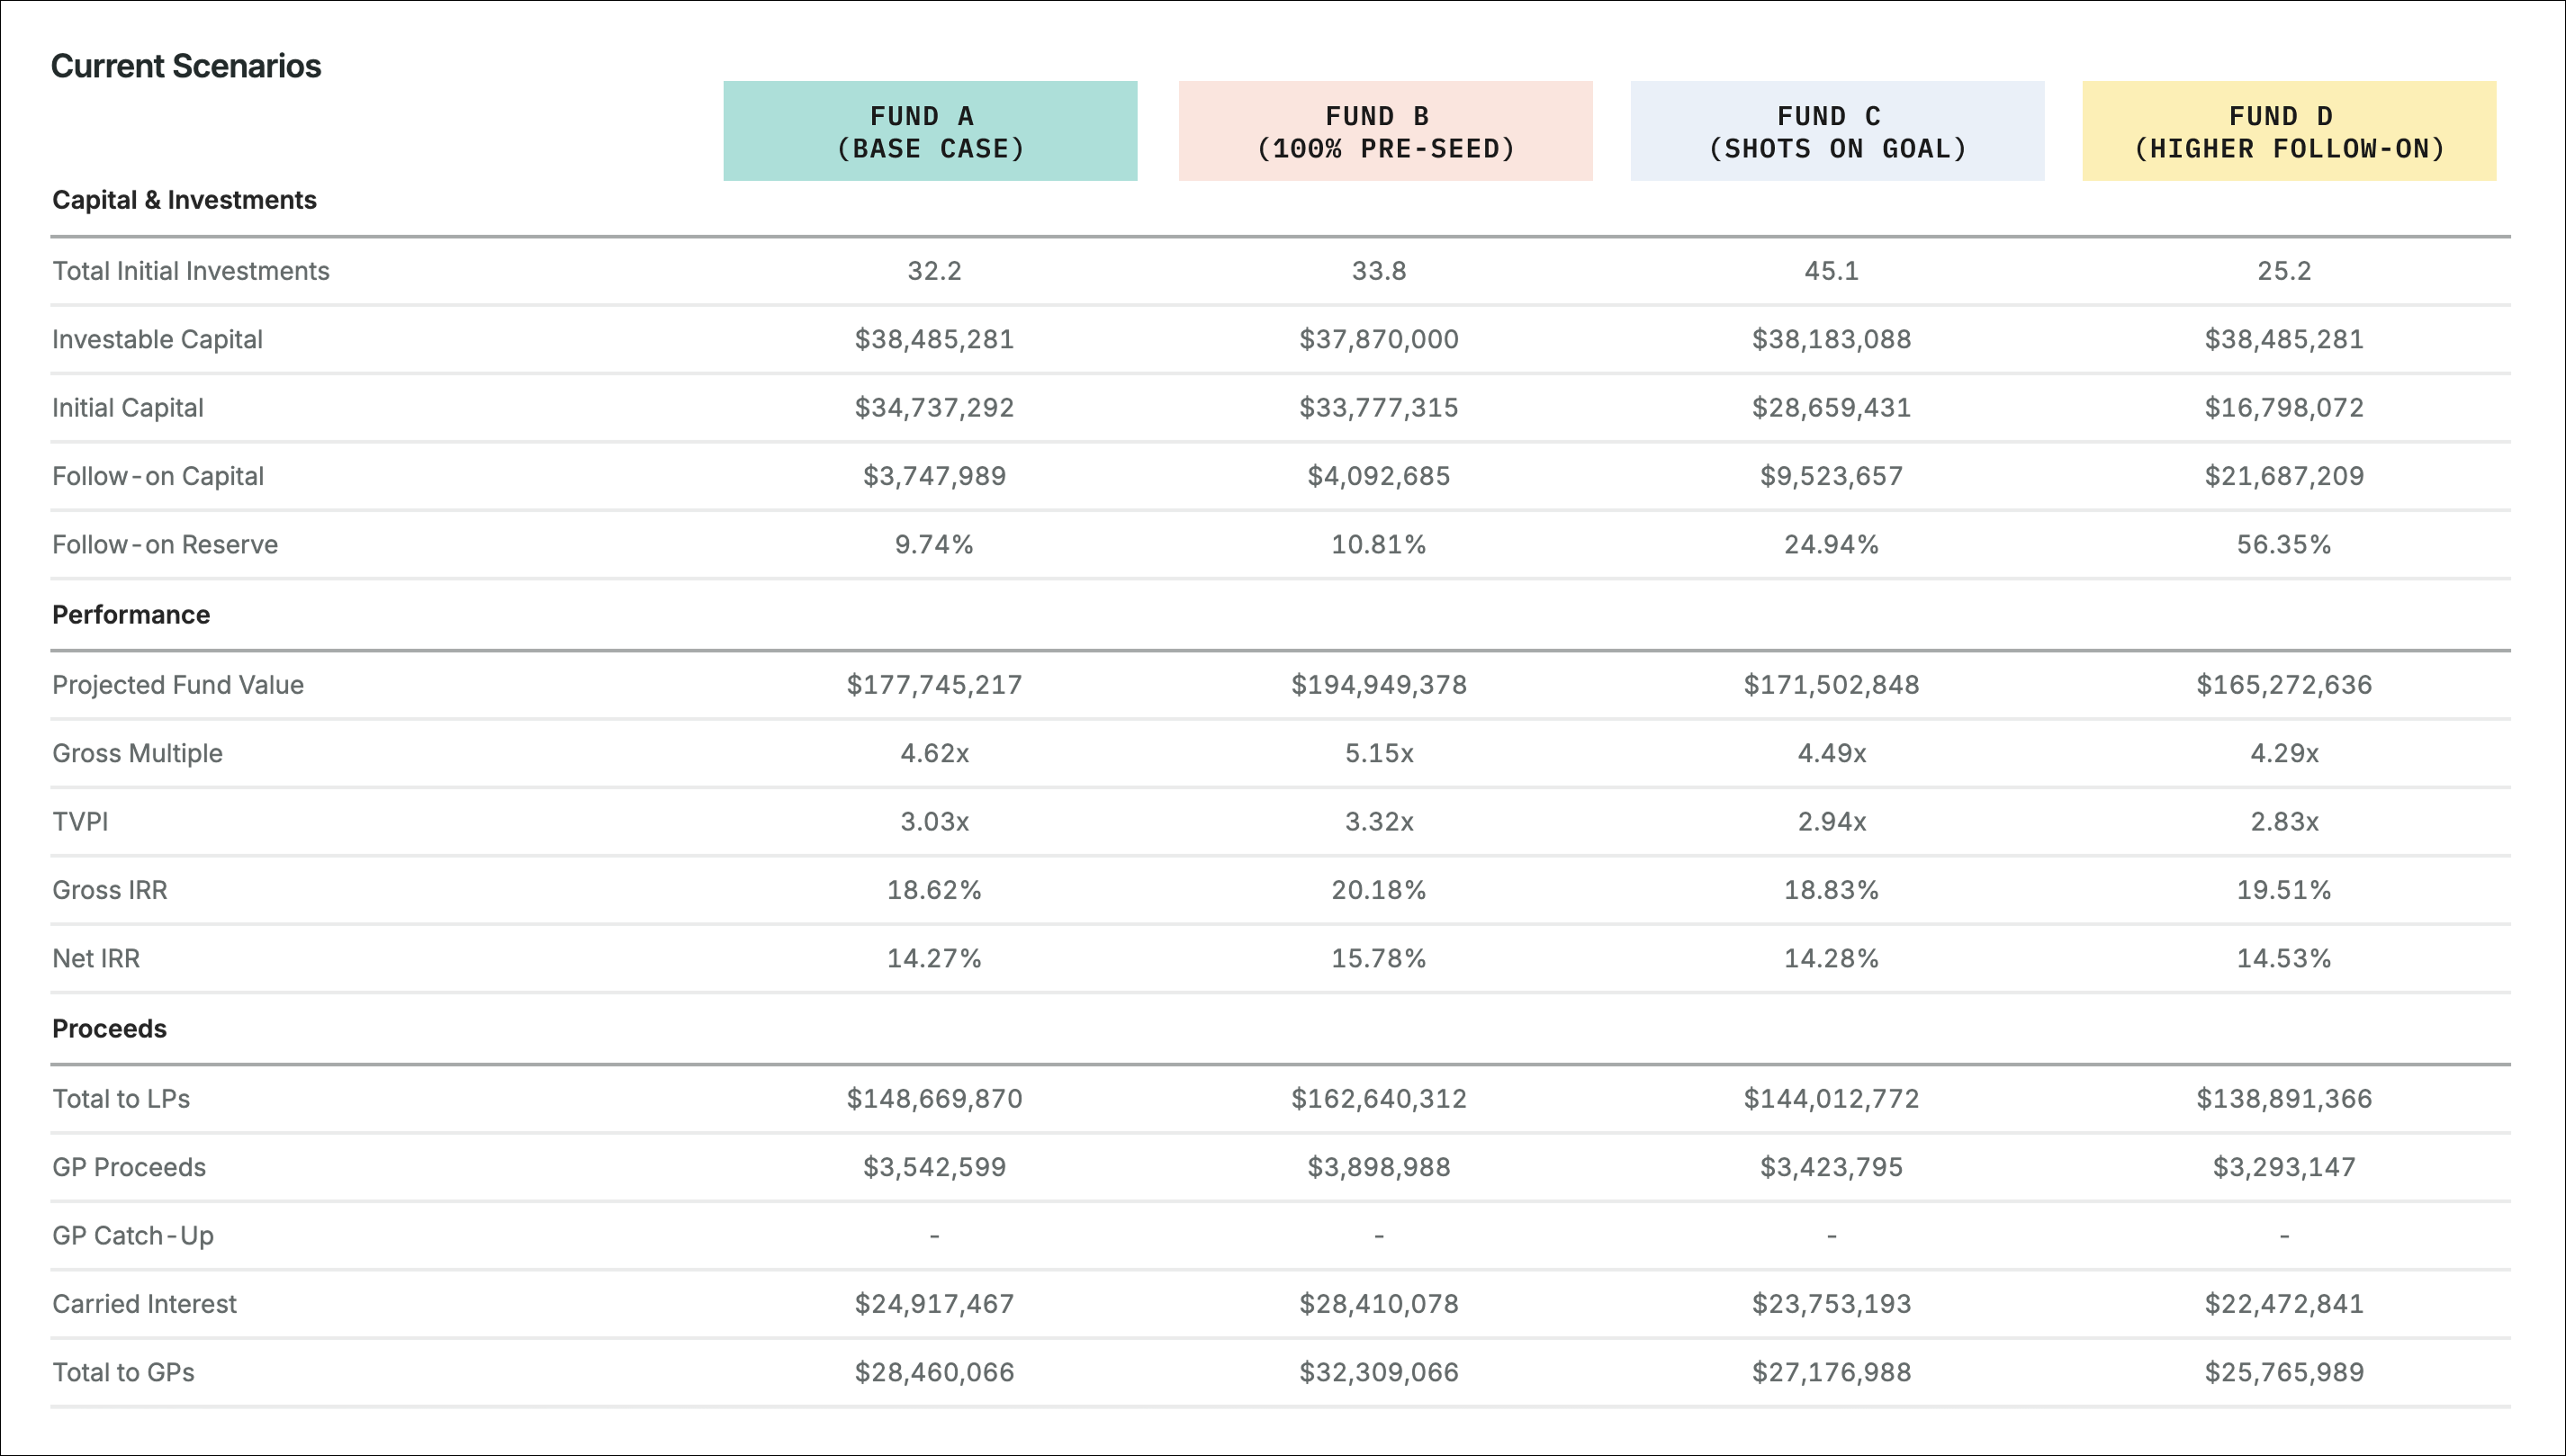
Even with the same initial capital and identical market conditions, modeling reveals that the differences in approach could result in a $6M differential in expected carry to the GP.
Key portfolio levers that can drive performance divergence
1. Risk profile: investment stages
The proportion of capital allocated to various investment stages (e.g., pre-seed vs. seed vs. Series A) defines the fund’s inherent risk/return profile. Models require distinct success rates (survival rates) and expected exit multiples for each stage. Allocating more to higher-risk, early-stage (pre-seed) companies models a higher number of failures but also targets significantly greater multiple expansion for the successes. The success of the fund hinges on the ability of the highest-risk capital to generate outsized returns. If the low-entry-valuation pre-seed companies do not graduate at the expected rate and multiple, the entire fund's performance will lag. Scenario modeling precisely calibrates the target exit multiple needed from the high-risk segment to compensate for the necessary failure rate.
In our modeling, a 30% reallocation from seed / Series A in the base case (Fund A) to pre-seed (Fund B) results in a 0.3x increase in TVPI (from 3.0x to 3.3x). This pre-seed strategy also assumes slightly faster partial sales of portfolio companies, which contributes to the increase in TVPI.
2. Number of investments: Shots on goal vs. high conviction
One of the biggest levers of performance, particularly for seed-stage funds, is the number of portfolio companies. This requires finding a fine balance between target initial ownership and reserve ratios to ensure there is enough critical mass of portfolio companies. The interplay between these variables can only be evaluated with a flexible model that can respond to changes on each variable.
The optimal number of portfolio companies can vary depending on your strategy. Whether you take a broad-based approach (40+ initial checks) or a concentrated approach (25-35 initial checks), the decision must be based on your assessment of the risk profile, success rates, and expected exit multiples.
The target number of investments is ultimately a performance driver that must be modeled against execution feasibility. You need to determine the maximum number of investments your team is capable of sourcing, conducting due diligence on, and managing.
Taking a “shots on goal” approach with more, smaller investments maximizes exposure to the market but dilutes average ownership. This strategy requires a proportionally higher number of small exits or a few massive outliers to drive fund performance due to the low stakes in most companies.
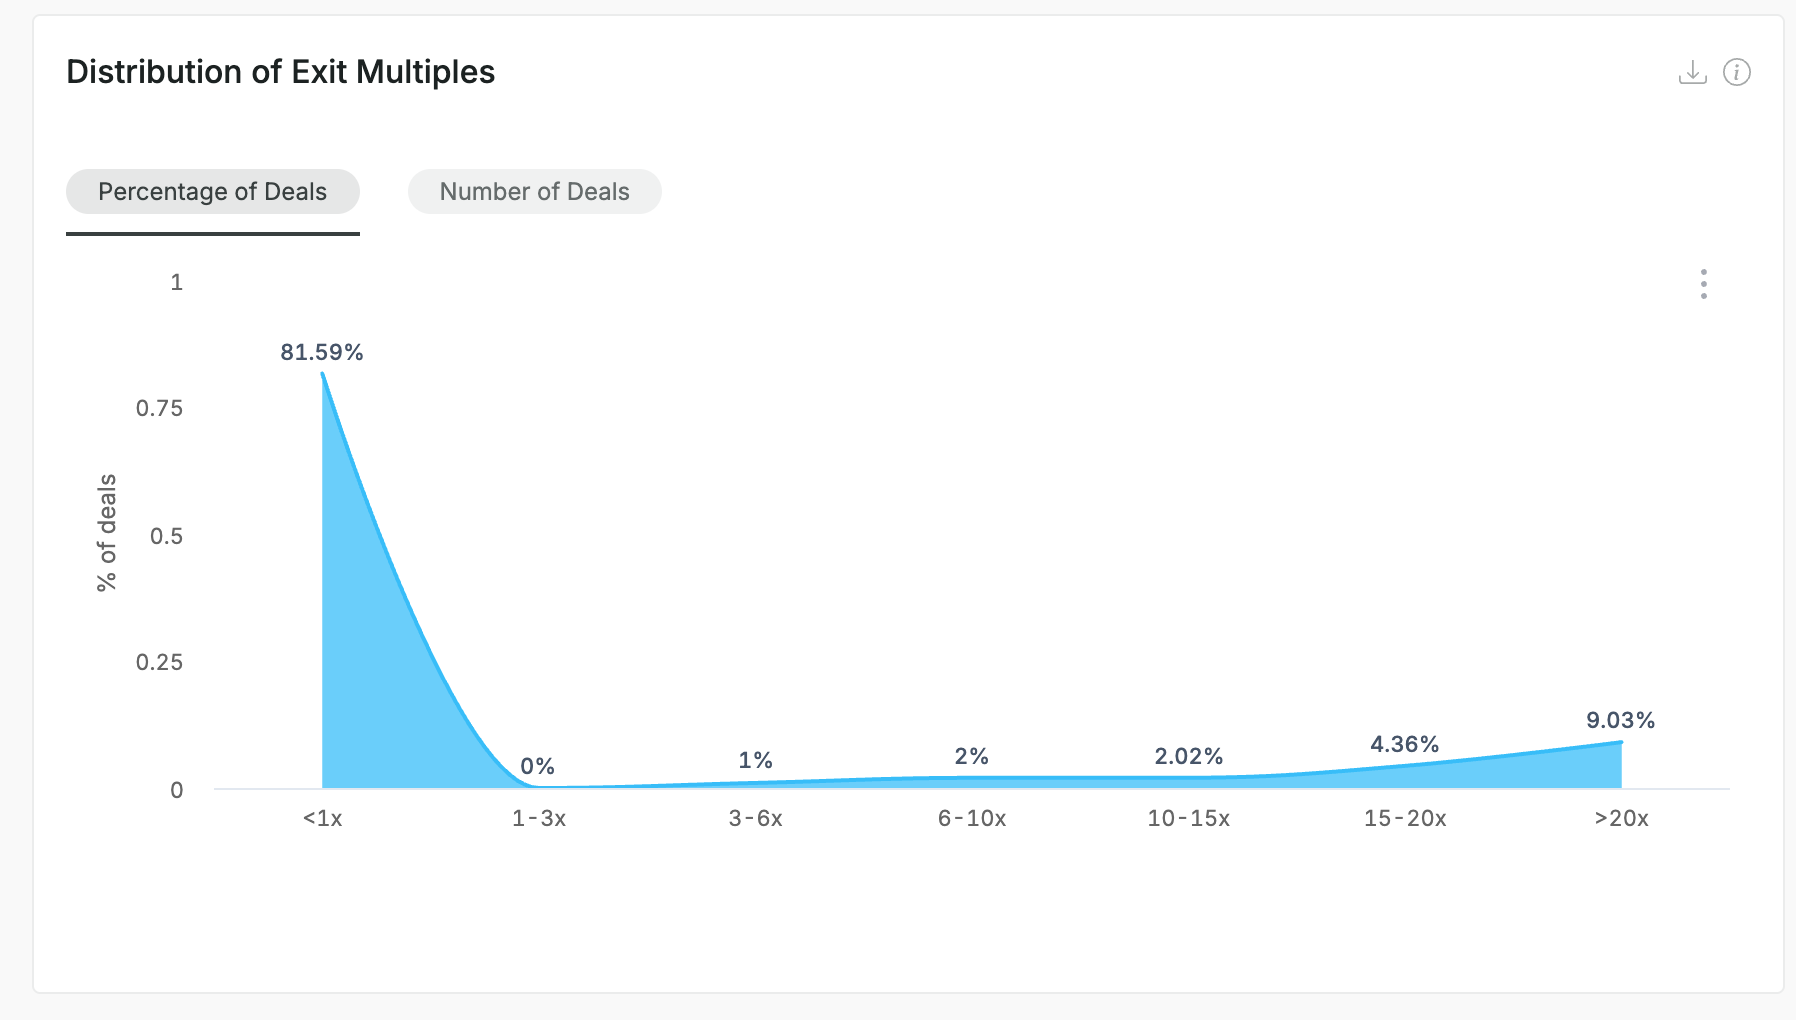
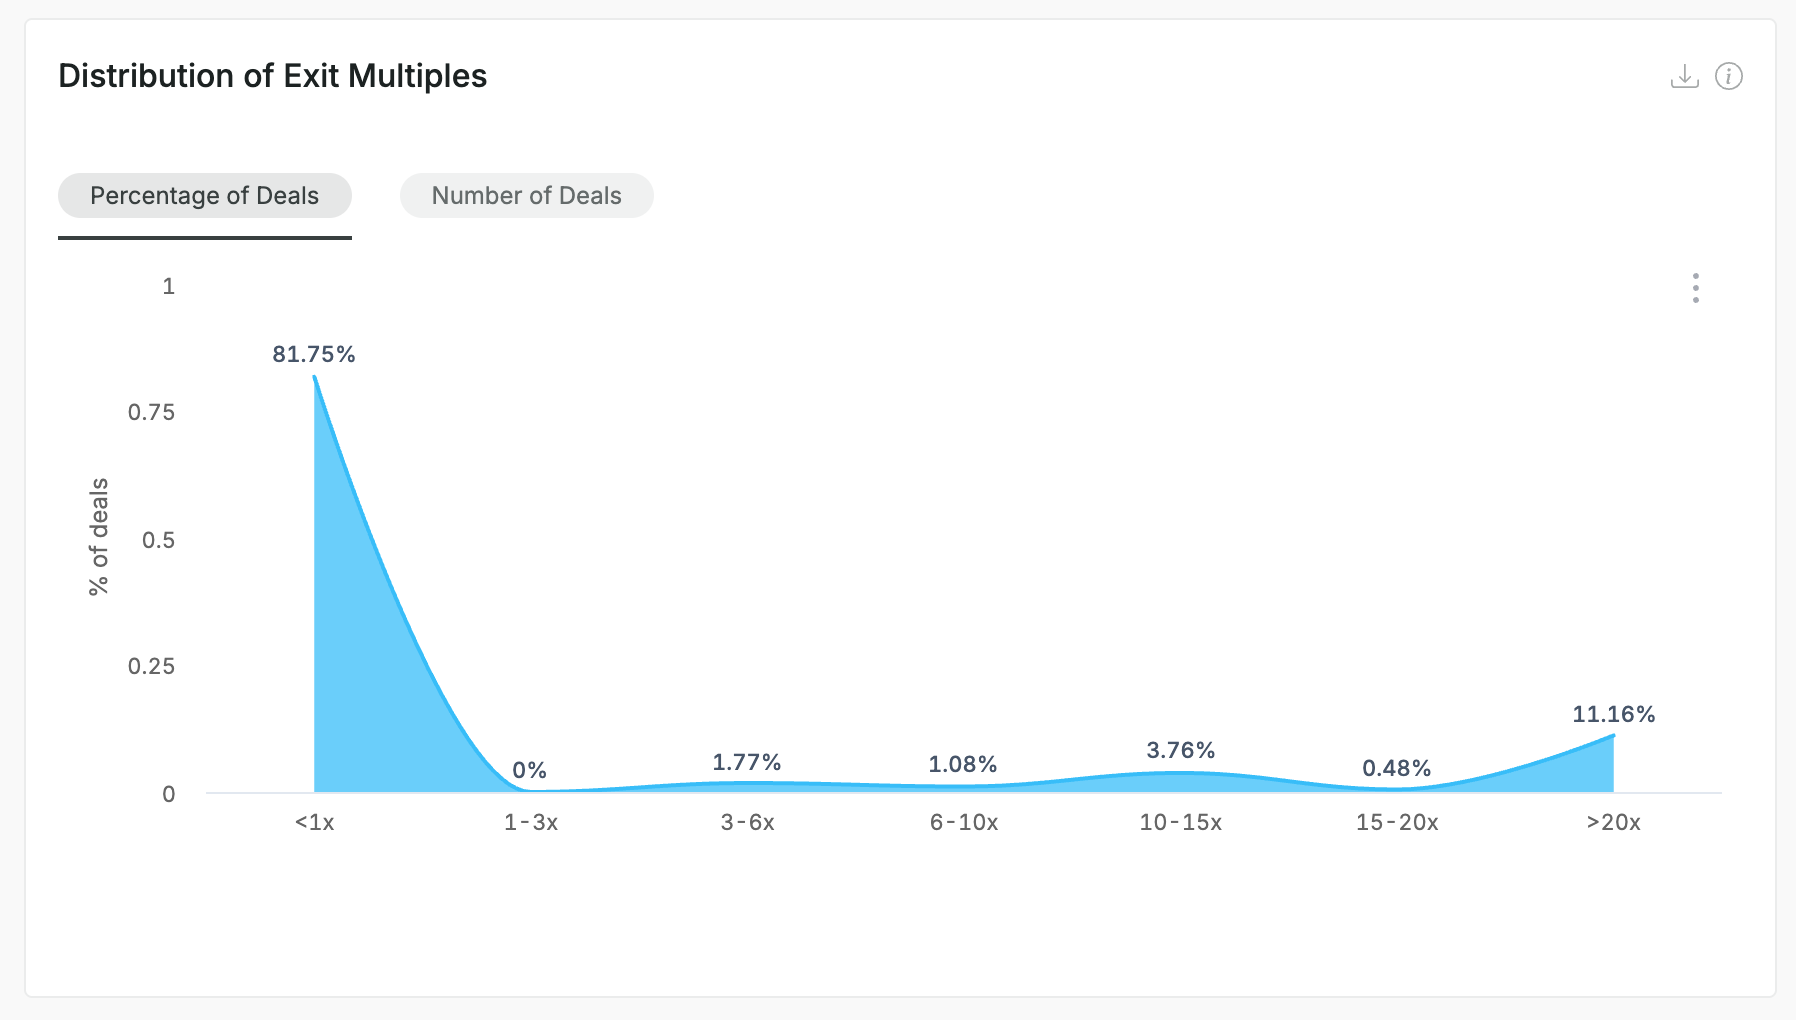
In our modeling, the expected return profile for a more concentrated portfolio strategy (Fund A) versus a higher “shots on goal” strategy (Fund C) yields a similar outcome—a 0.1x differential in TVPI. This makes sense given the models assume the same size of unicorns and the yield they will generate. In either scenario, the distribution of exit multiples mirrors each other, emphasizing the fundamental concept of the power law in VC portfolio construction. However, the underlying risk, feasibility to execute, and ownership considerations vary meaningfully and will ultimately drive overall returns.
Fund A (Base case)
Fund C (Shots on goal)
3. Ownership in companies: initial and reserve check sizing
The initial check size and the subsequent reserve strategy directly determine the fund's strategic ownership throughout the portfolio company's life cycle.
For seed-based strategies, the typical minimum ownership historically has been 10% (although some larger funds can go up to 15%) for a majority of the portfolio investments, with some GPs reserving capital for speculative investments where they may take less ownership.
When initial checks are too small, the fund acquires minimal ownership at the cheapest valuation points. If later follow-on rounds are required to maintain a meaningful stake, the capital is deployed at higher, more expensive valuations.
Scenario modeling allows GPs to test the effect of different reserve allocations. It demonstrates that insufficient reserves or overly small initial checks can lead to dilutive performance. It quantifies the returns lost by missing out on the value creation of winners due to an inability to maintain pro-rata or by deploying follow-on capital at less favorable prices.
In our modeling, an increased reserve ratio (from 10% to nearly 50%), combined with a slightly smaller number of initial investments, results in a 0.2x difference in TVPI between Fund A (3.0x TVPI) and Fund D (2.8x).
By using scenario modeling to test these variables, GPs move beyond theoretical discussions to demonstrate with quantitative precision how their chosen portfolio construction drives the desired financial results and serves as a powerful differentiator for LPs.


DISCLOSURE: This communication is on behalf of eShares, Inc. dba Carta, Inc. ("Carta"). This communication is for informational purposes only, and contains general information only. Carta is not, by means of this communication, rendering accounting, business, financial, investment, legal, tax, or other professional advice or services. This publication is not a substitute for such professional advice or services nor should it be used as a basis for any decision or action that may affect your business or interests. Before making any decision or taking any action that may affect your business or interests, you should consult a qualified professional advisor. This communication is not intended as a recommendation, offer or solicitation for the purchase or sale of any security. Carta does not assume any liability for reliance on the information provided herein. This post contains links to articles or other information that may be contained on third-party websites. The inclusion of any hyperlink is not and does not imply any endorsement, approval, investigation, or verification by Carta, and Carta does not endorse or accept responsibility for the content, or the use, of such third-party websites. Carta assumes no liability for any inaccuracies, errors or omissions in or from any data or other information provided on such third-party websites. © 2026 eShares, Inc. dba Carta, Inc. All rights reserved. Reproduction prohibited.