Executive summary
The private equity industry is increasingly using equity to align incentives with the management teams at their portfolio companies. But different types of PE-backed portfolio companies can approach equity compensation in different ways.
Specifically, there can be stark differences in the equity strategies typically pursued by PE-backed corporations and PE-backed LLCs. Our latest analysis of data from the thousands of PE portfolio companies that work with Carta highlights some of the most significant contrasts.
At PE-backed corporations, it’s most common for equity grants issued to members of management teams—defined here as executives at the VP level and above—to vest on a monthly cadence. About 71% of initial grants issued to executives at PE-backed corporations come with monthly vesting, while just under 10% vest annually.
For executives at PE-backed LLCs, vesting schedules look quite different. Among this population, annual vesting is far more common, accounting for 80% of initial grants. And monthly vesting is far less common, at just 12.5% of the sample.
Another difference: Initial grants to executives at corporations are more likely to have vesting cliffs than initial grants issued by LLCs. At PE-backed corporations, just over 70% of all initial grants to executives have a cliff, which almost always occurs at one year. At PE-backed LLCs, about 57% of initial executive grants come with a cliff.
The use of equity across the PE-backed universe can differ in many other ways, too. Companies in different sectors have different norms. Some equity grants come with performance conditions, while others do not. Executives tend to receive different grants than other employees.
To be sure, equity compensation is being used more broadly than ever across the spectrum of PE-backed portfolio companies. But some of those companies are using it in very different ways.
Report highlights
CEOs are the main equity recipients at PE-backed corporations: The median initial grant issued to non-founder CEOs at PE-backed corporations comprises about 2.3% of total company equity, nearly five times greater than the median initial grant for other members of the C-suite (0.45%). From there, the drop-off is steep: The median initial C-suite grant is 37 times larger than the median initial grant to SVPs.
Performance conditions are the norm for execs at PE-backed LLCs: About 57% of initial grants issued to members of management teams at PE-backed LLCs include performance conditions, with conditions based on the financial return the company generates for its owner being the most common. Just under 60% of initial grants for executives at PE-backed LLCs are conditional on MOIC, IRR, or a similar metric.
Refresh grant sizes are getting proportionally bigger: From 2023 to 2025, the median size of refresh grants issued to executives at PE-backed LLCs increased from 46.4% of initial grant size all the way to 72.7% of initial grant size. For employees, the typical grant size rose from 38% of the initial grant to 61.5% over the same span, reflecting a growing desire to incentivize and retain top talent.
PE-backed corporations
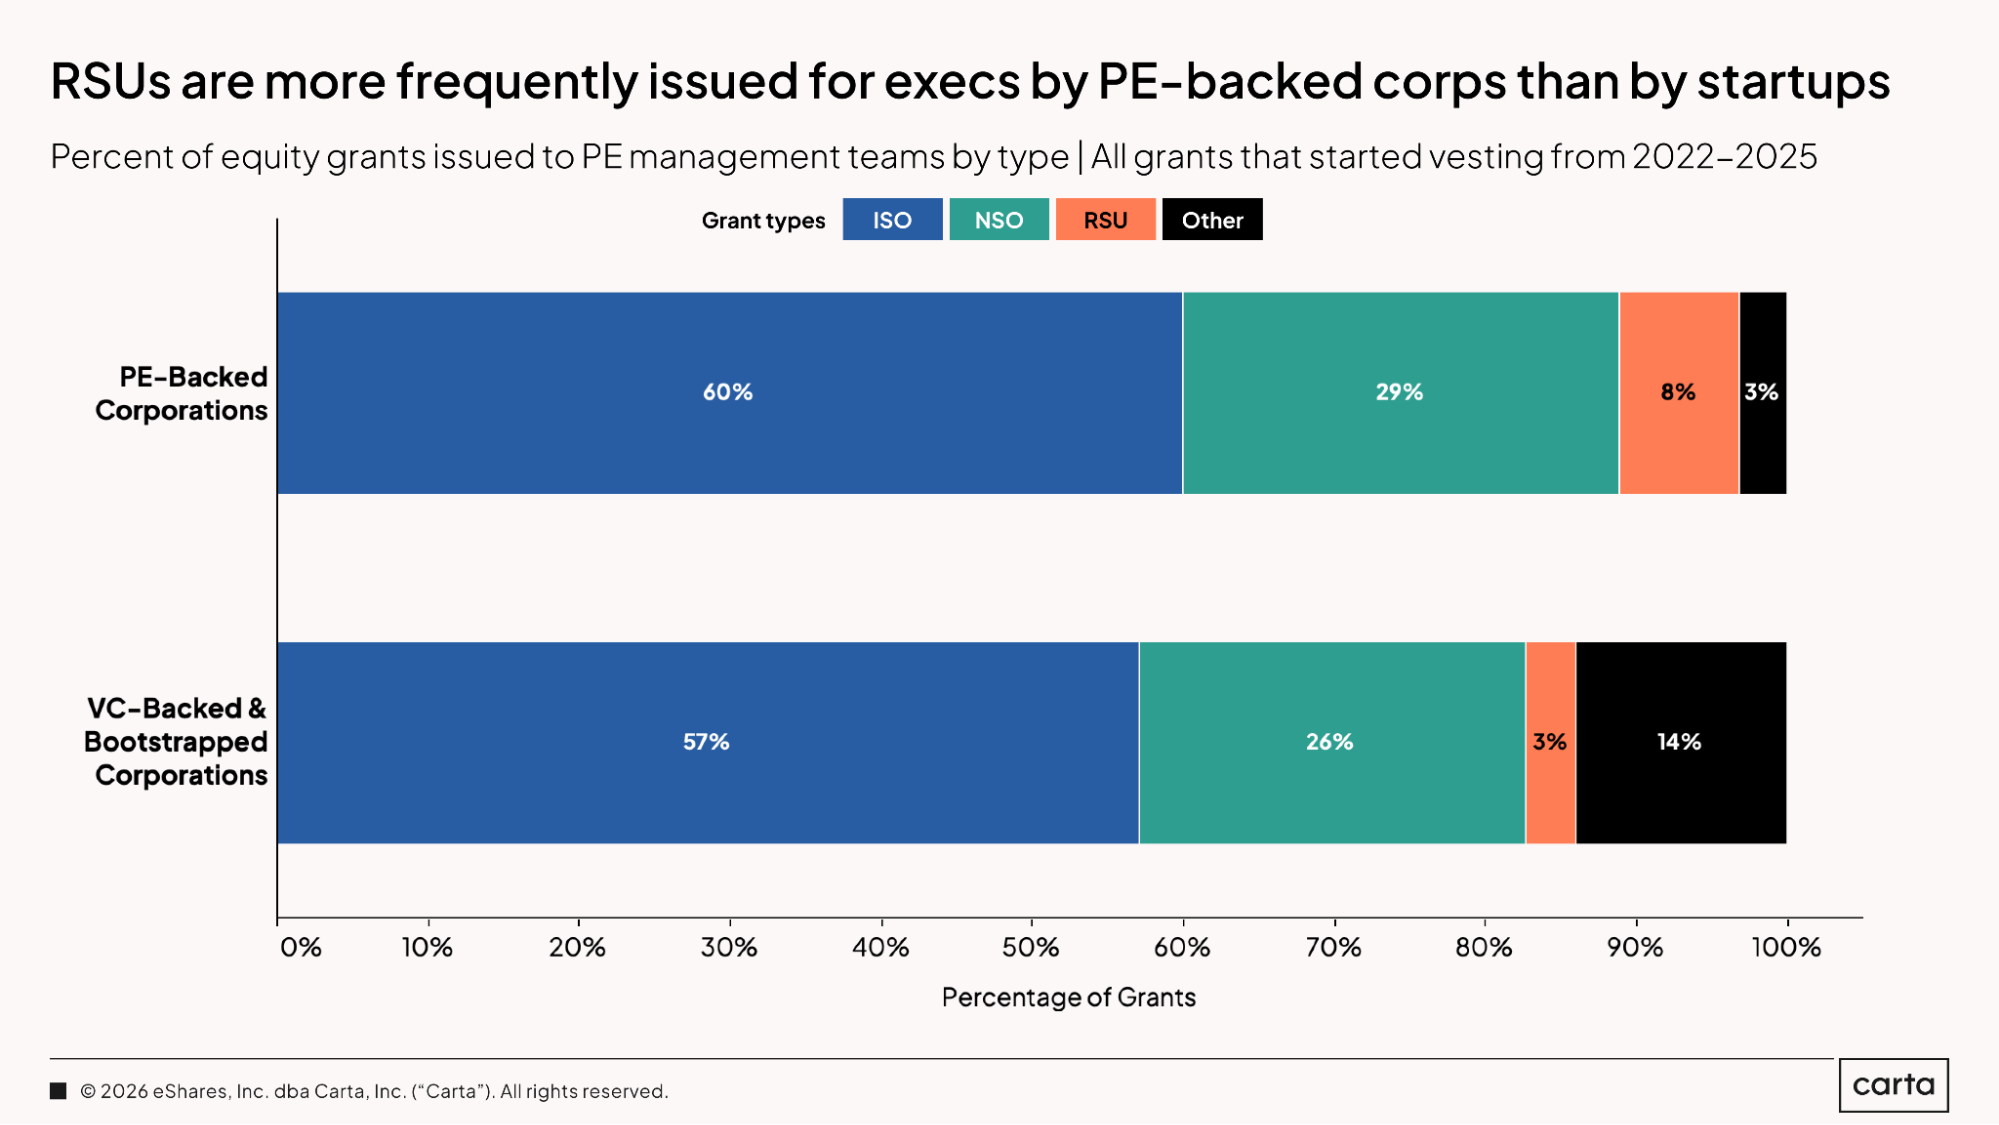
When PE-backed corporations issue equity grants to their employees, about 60% of those grants take the form of ISOs, while 29% are NSOs and 8% are RSUs.
The frequency of RSUs is the biggest difference in the makeup of equity grants issued by PE-backed corporations versus those issued by corporations that are VC-backed or bootstrapped: That 8% figure for PE-backed corporations is nearly three times higher than the 3% rate of RSUs among startups. Startups are substantially more likely to issue grants in some other form other than ISOs, NSOs, or RSUs.
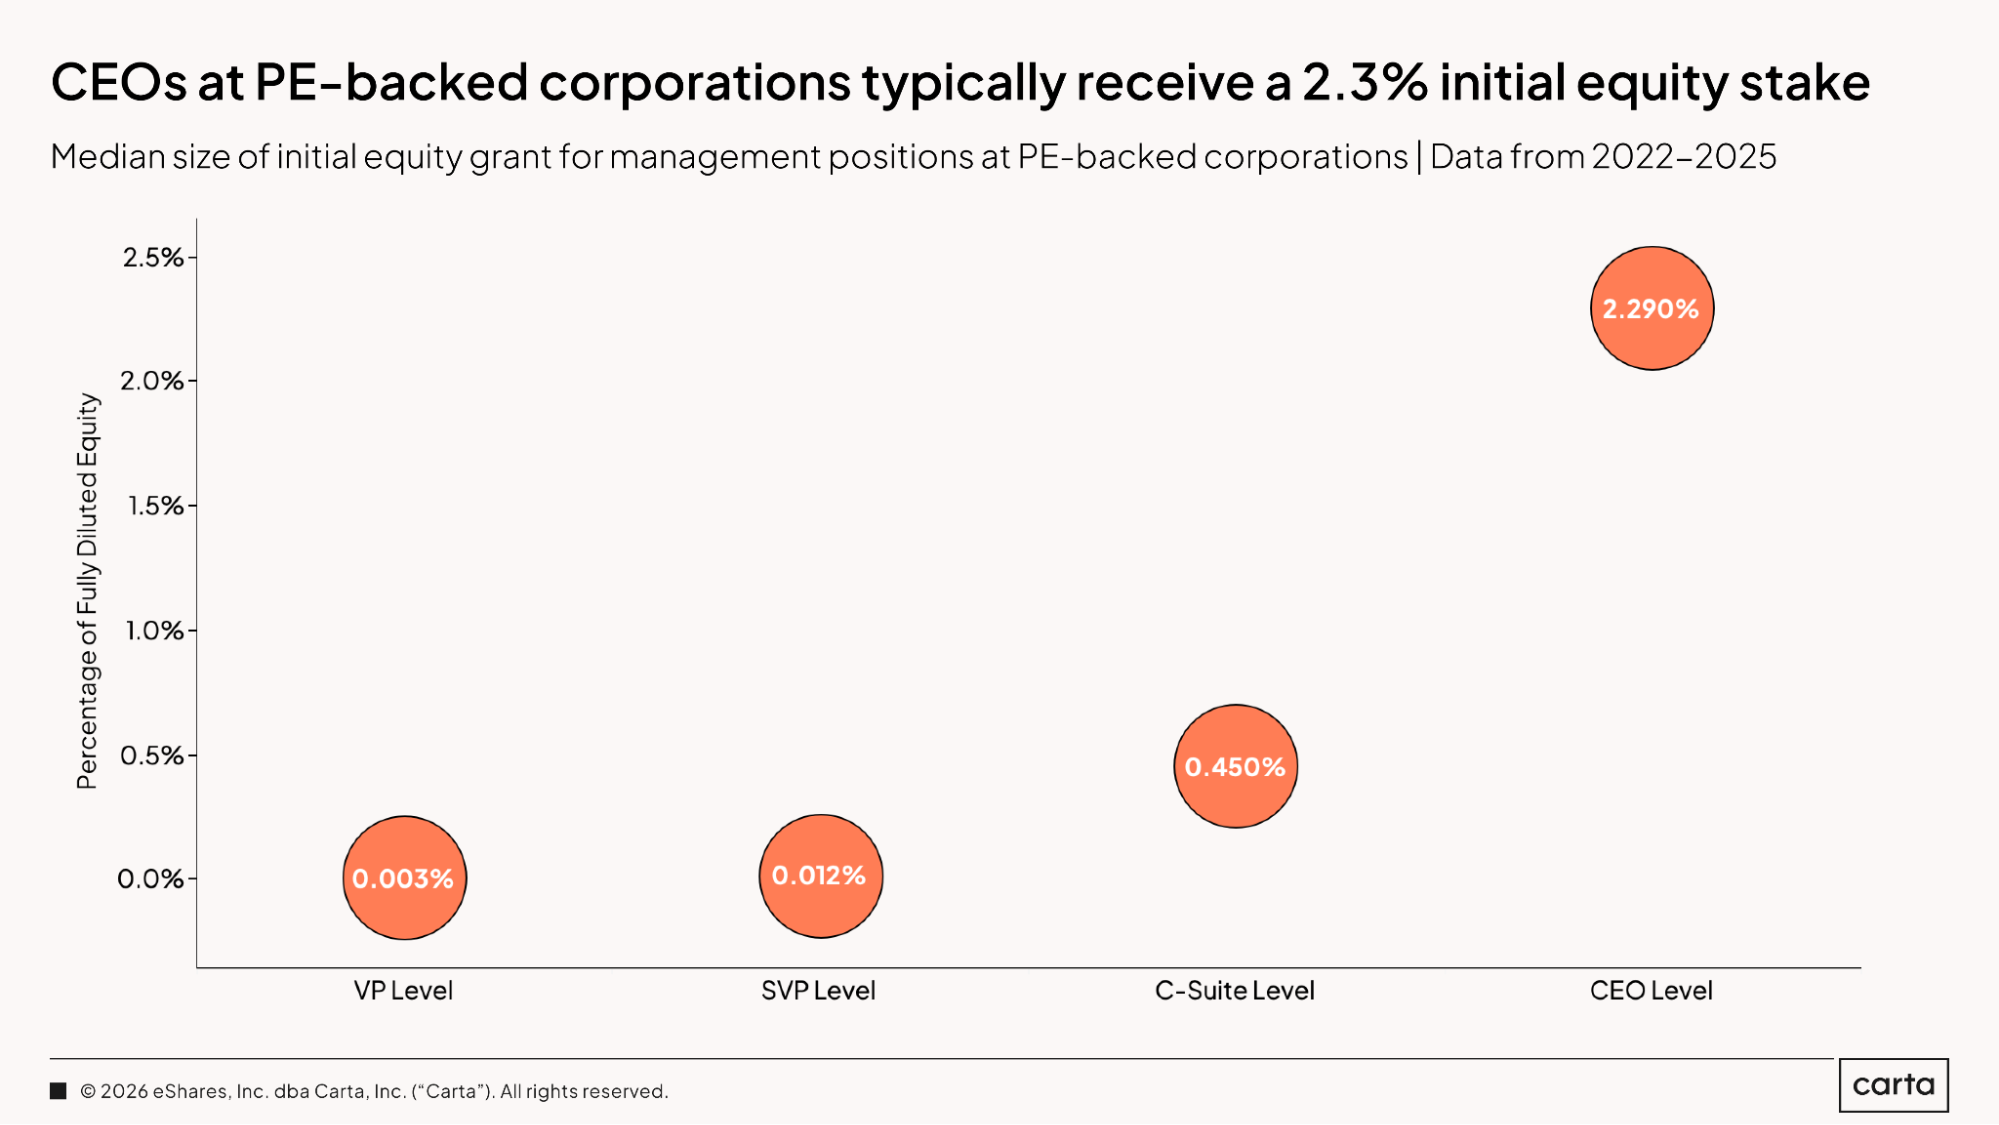
Among PE-backed corporations that issue equity to employees, the median non-founder CEO receives an initial grant comprising 2.29% of the company’s total equity. For non-CEO members of the C-suite, the median initial grant size is 0.45% of total equity. No other job level typically receives an initial grant that’s equal to more than .01% of a PE-backed corporation’s total ownership.
Full report available: Start reading now for free
Our complete PE Executive Equity Report includes more charts and analysis on grant percentages, industry breakdowns, vesting schedules, performance conditions, and more for executives at PE-backed corporations and LLCs.


DISCLOSURE: This communication is on behalf of eShares, Inc. dba Carta, Inc. ("Carta"). This communication is for informational purposes only, and contains general information only. Carta is not, by means of this communication, rendering accounting, business, financial, investment, legal, tax, or other professional advice or services. This publication is not a substitute for such professional advice or services nor should it be used as a basis for any decision or action that may affect your business or interests. Before making any decision or taking any action that may affect your business or interests, you should consult a qualified professional advisor. This communication is not intended as a recommendation, offer or solicitation for the purchase or sale of any security. Carta does not assume any liability for reliance on the information provided herein. © 2026 Carta. All rights reserved. Reproduction prohibited.