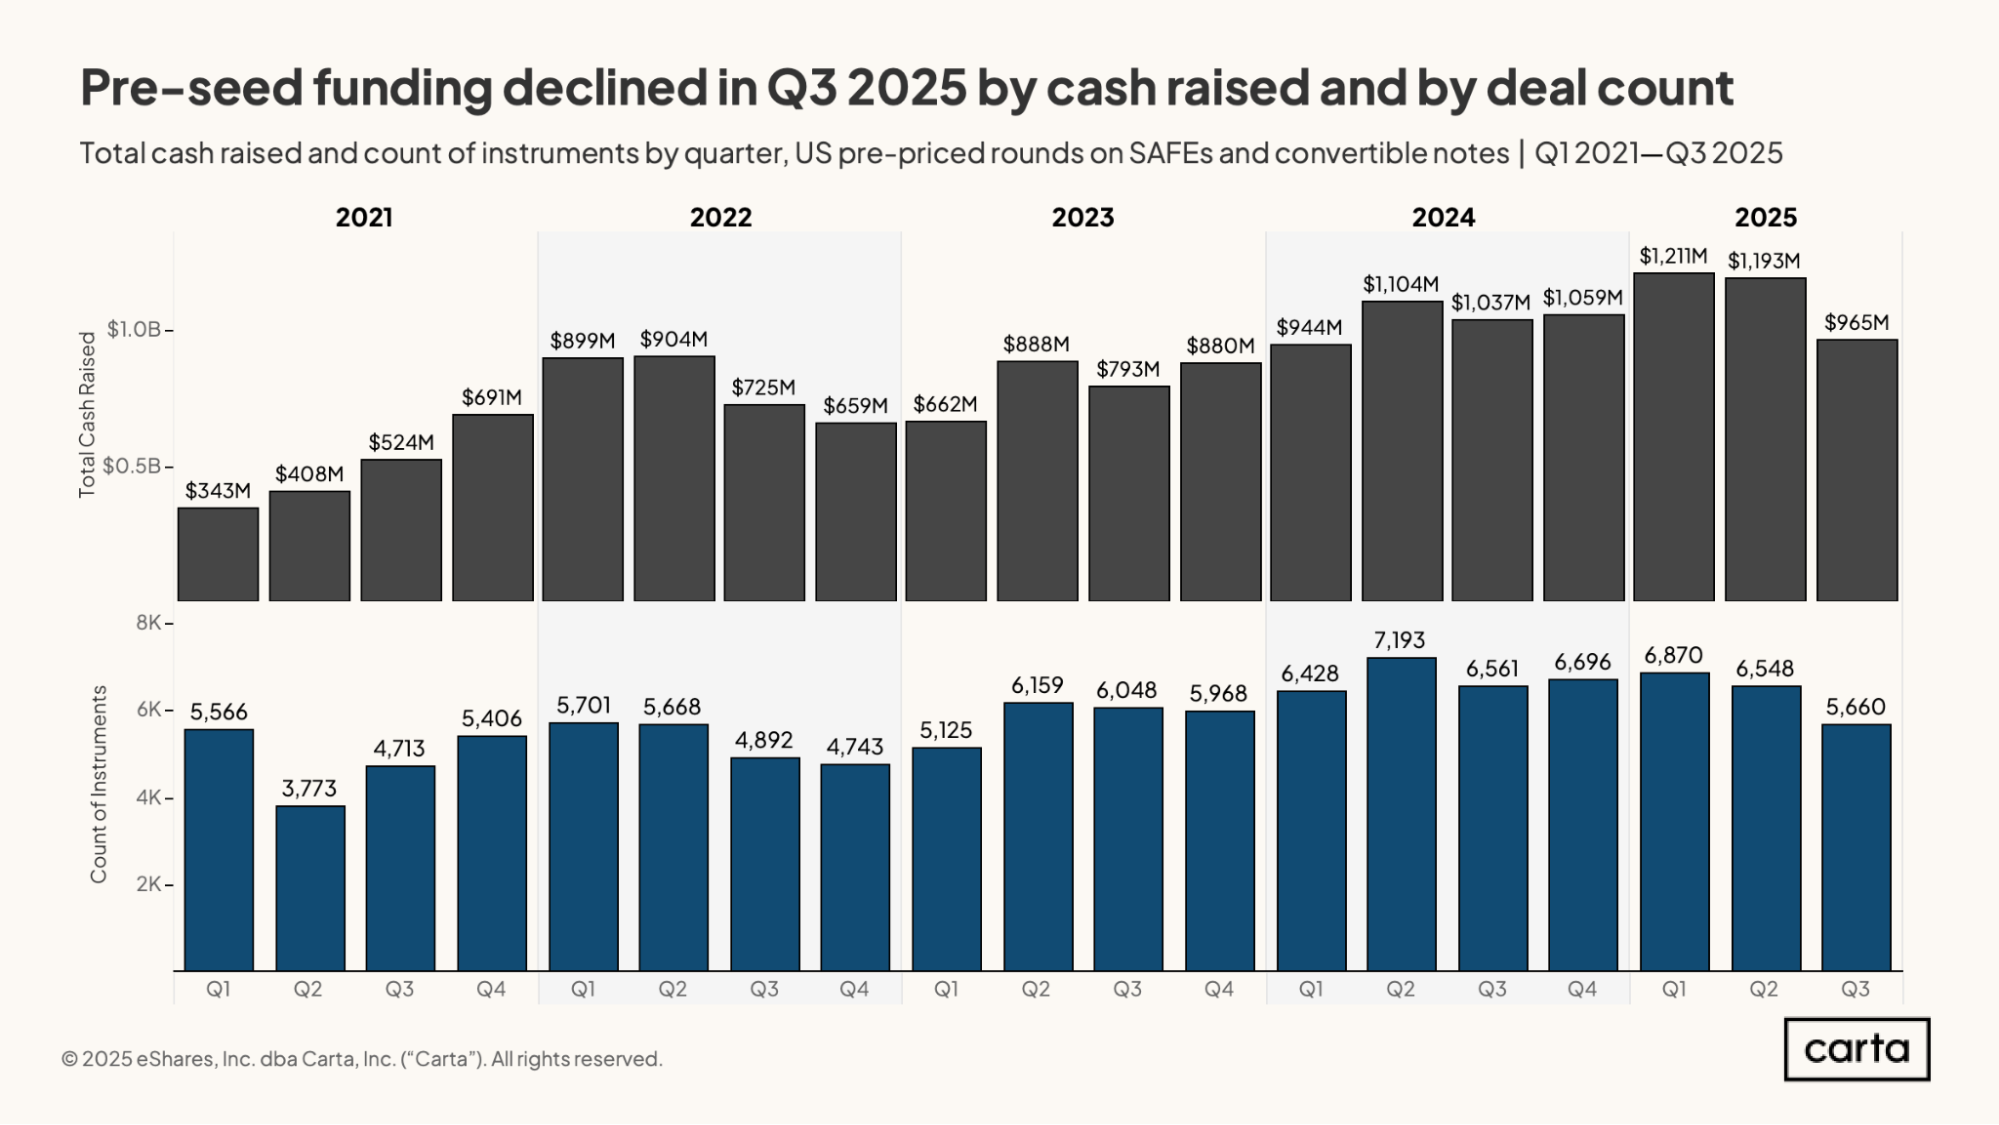
How did the third quarter of 2025 pan out for pre-seed fundraising? Startups in the U.S. raised $965 million across 5,660 instruments, including both SAFEs and convertible notes. This represents a decline from Q2 in terms of both cash raised and count of instruments, though Q3 figures will likely end up slightly higher as more data is added in the coming weeks.
Looking at the broader picture, pre-seed investment volume on Carta has been increasing since late 2022. Total cash invested at the pre-seed stage peaked in Q1 of 2025 at $1.2 billion. The last two quarters have been a bit slower than Q1, though it still seems that total pre-seed funding activity in 2025 will outpace 2024.
Most pre-seed fundraises occur on post-money SAFEs, though pre-money SAFEs and convertible notes are also used. While all industries primarily use SAFEs now, those with the highest representation of convertible notes are energy, biotech/pharma, and medical devices. As the Federal Reserve cut interest rates twice in 2025, interest rates on convertible notes have also trended downward.
Read on for the latest data on pre-seed fundraising volume, deal terms, regional trends, industry dynamics, and more.
Q3 2025 highlights
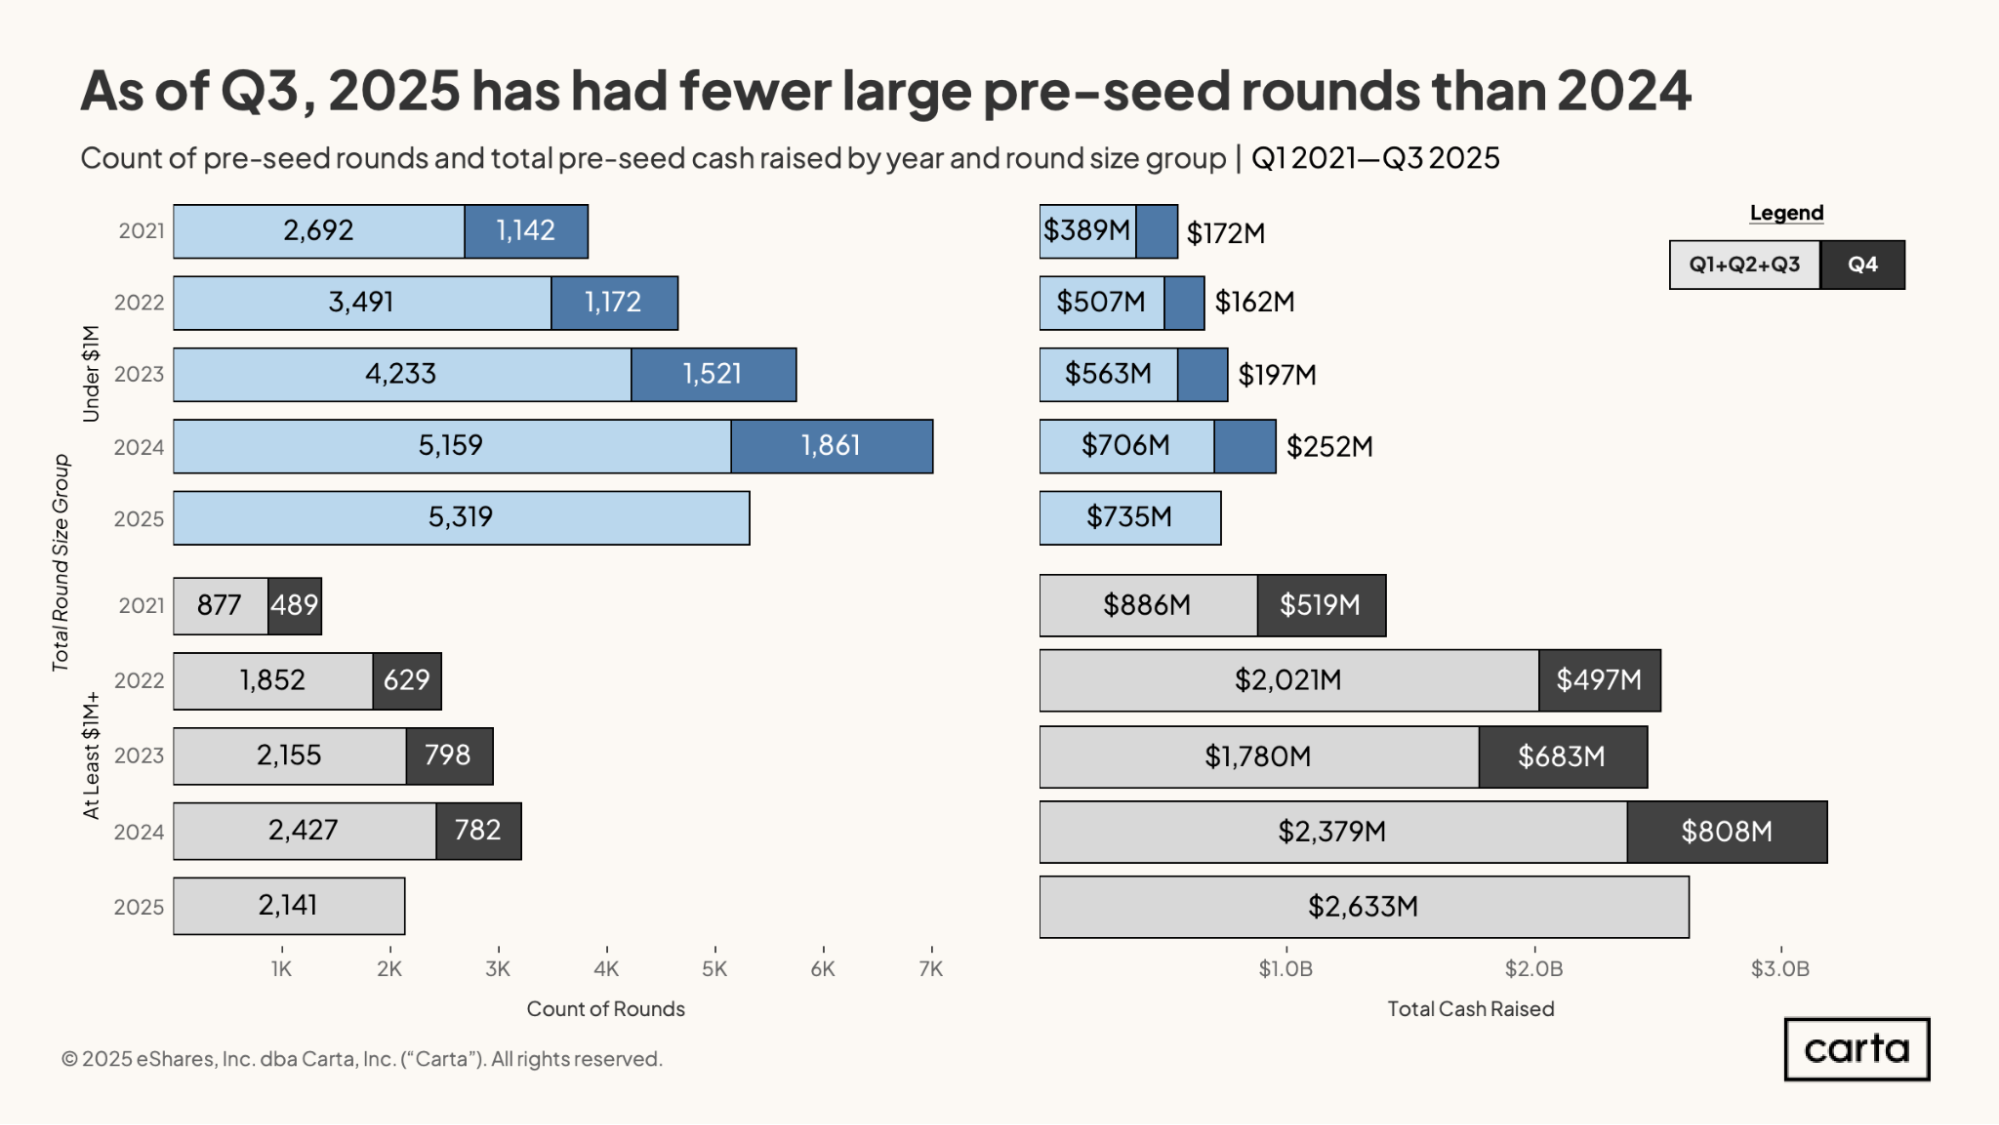
Concentration of capital: Compared to the first three quarters of 2024, the same time period of 2025 had more pre-seed rounds under $1 million and fewer larger than $1 million. At the same time, the cash raised across all rounds above $1 million has been higher in 2025 than in 2024.
Val caps hold steady or climb: In the past 12 months, valuation caps for post-money SAFEs have stayed flat for most round sizes. However, val caps rose for large round sizes of at least $2.5 million. Val caps are more volatile for convertible notes and have trended upward for most round sizes.
Geographical trends: Despite some fluctuations, the Western census region continues to take in half of all pre-seed fundraising in the U.S. The five metro areas with the most pre-seed cash raised by startups are Bay Area, New York, Boston, Los Angeles, and D.C.
Spotlight on healthtech: Pre-seed startups in healthtech have raised $319 million year-to-date, making it the third largest industry by total cash invested and second largest by count of rounds. Healthtech also has some of the highest val caps, with a median of $35 million for rounds of at least $2.5 million.
Key trends
Full report available: Start reading now for free
Our complete State of Pre-Seed: Q3 2025 report includes 30 charts and analysis on SAFEs, convertible notes, dilution, discount percentages, and specific industries.

DISCLOSURE: This communication is on behalf of eShares, Inc. dba Carta, Inc. ("Carta"). This communication is for informational purposes only, and contains general information only. Carta is not, by means of this communication, rendering accounting, business, financial, investment, legal, tax, or other professional advice or services. This publication is not a substitute for such professional advice or services nor should it be used as a basis for any decision or action that may affect your business or interests. Before making any decision or taking any action that may affect your business or interests, you should consult a qualified professional advisor. This communication is not intended as a recommendation, offer or solicitation for the purchase or sale of any security. Carta does not assume any liability for reliance on the information provided herein. © 2026 Carta. All rights reserved. Reproduction prohibited.