
Historically, it’s been difficult to glean much detailed information about the hows, whats, and whys of private fund economics. This is because these funds are, well, private. The public might be aware of how much capital a private fund raises, or what companies it invests in, or even some information about how the fund performs. But many of the details of how private funds operate have remained behind the curtain until now.
With this 2025 Fund Economics Report—the first of its kind—Carta aims to provide a never-before-seen glimpse at some of the latest data on how venture capital and private equity investors manage and operate their funds.
Who do fund GPs raise capital from? How much of their own capital do they contribute? How quickly do fund managers call down capital—and how quickly do LPs respond? What are the typical management fees and carried interest rates for recent venture funds? How do fees change over time? What are the largest fund-related expenses that GPs and LPs must consider?
Leveraging data from some 2,000 private funds that rely on Carta for fund administration, this report offers a look under the hood at many of the key financial and operational details that are critical to raising, managing, and investing in private funds. With these insights in hand, fund managers and their LPs can make better, more informed decisions about how and where to invest in an ever-evolving private capital landscape.
Highlights
PE fund managers have more skin in the game: In venture capital, the median fund manager makes a GP entity commitment totaling 1.7% of the fund size. In private equity, the median GP entity commitment is 50% higher, at 2.55%.
Most capital calls are fulfilled on time: Across all recent fund VC vintages, at least 75% of capital calls to LPs are fulfilled at or prior to the given deadline. The longer the notice period given for a capital call, the more likely LPs will wire the capital earlier than requested.
Venture funds from 2022 are spending more slowly: After nearly four years, the median 2022 vintage VC fund had deployed 67% of its capital. Most other recent vintages had deployed around 80% of their capital at the same threshold in time.
Management fees and carry rates have remained steady: Across all recent VC vintages, the 2-and-20 fee structure remains the norm, with a median management fee during the investment period of 2% and the median GP taking 20% of a fund’s profits in carried interest.
Venture funds benefit from economies of scale: The median VC fund between $1 million to $10 million spends about 3.4% of its fund size on operating expenses within the first five years. The median fund larger than $100 million only spends 1% of its fund size on expenses in the same time frame.
Partner commitments
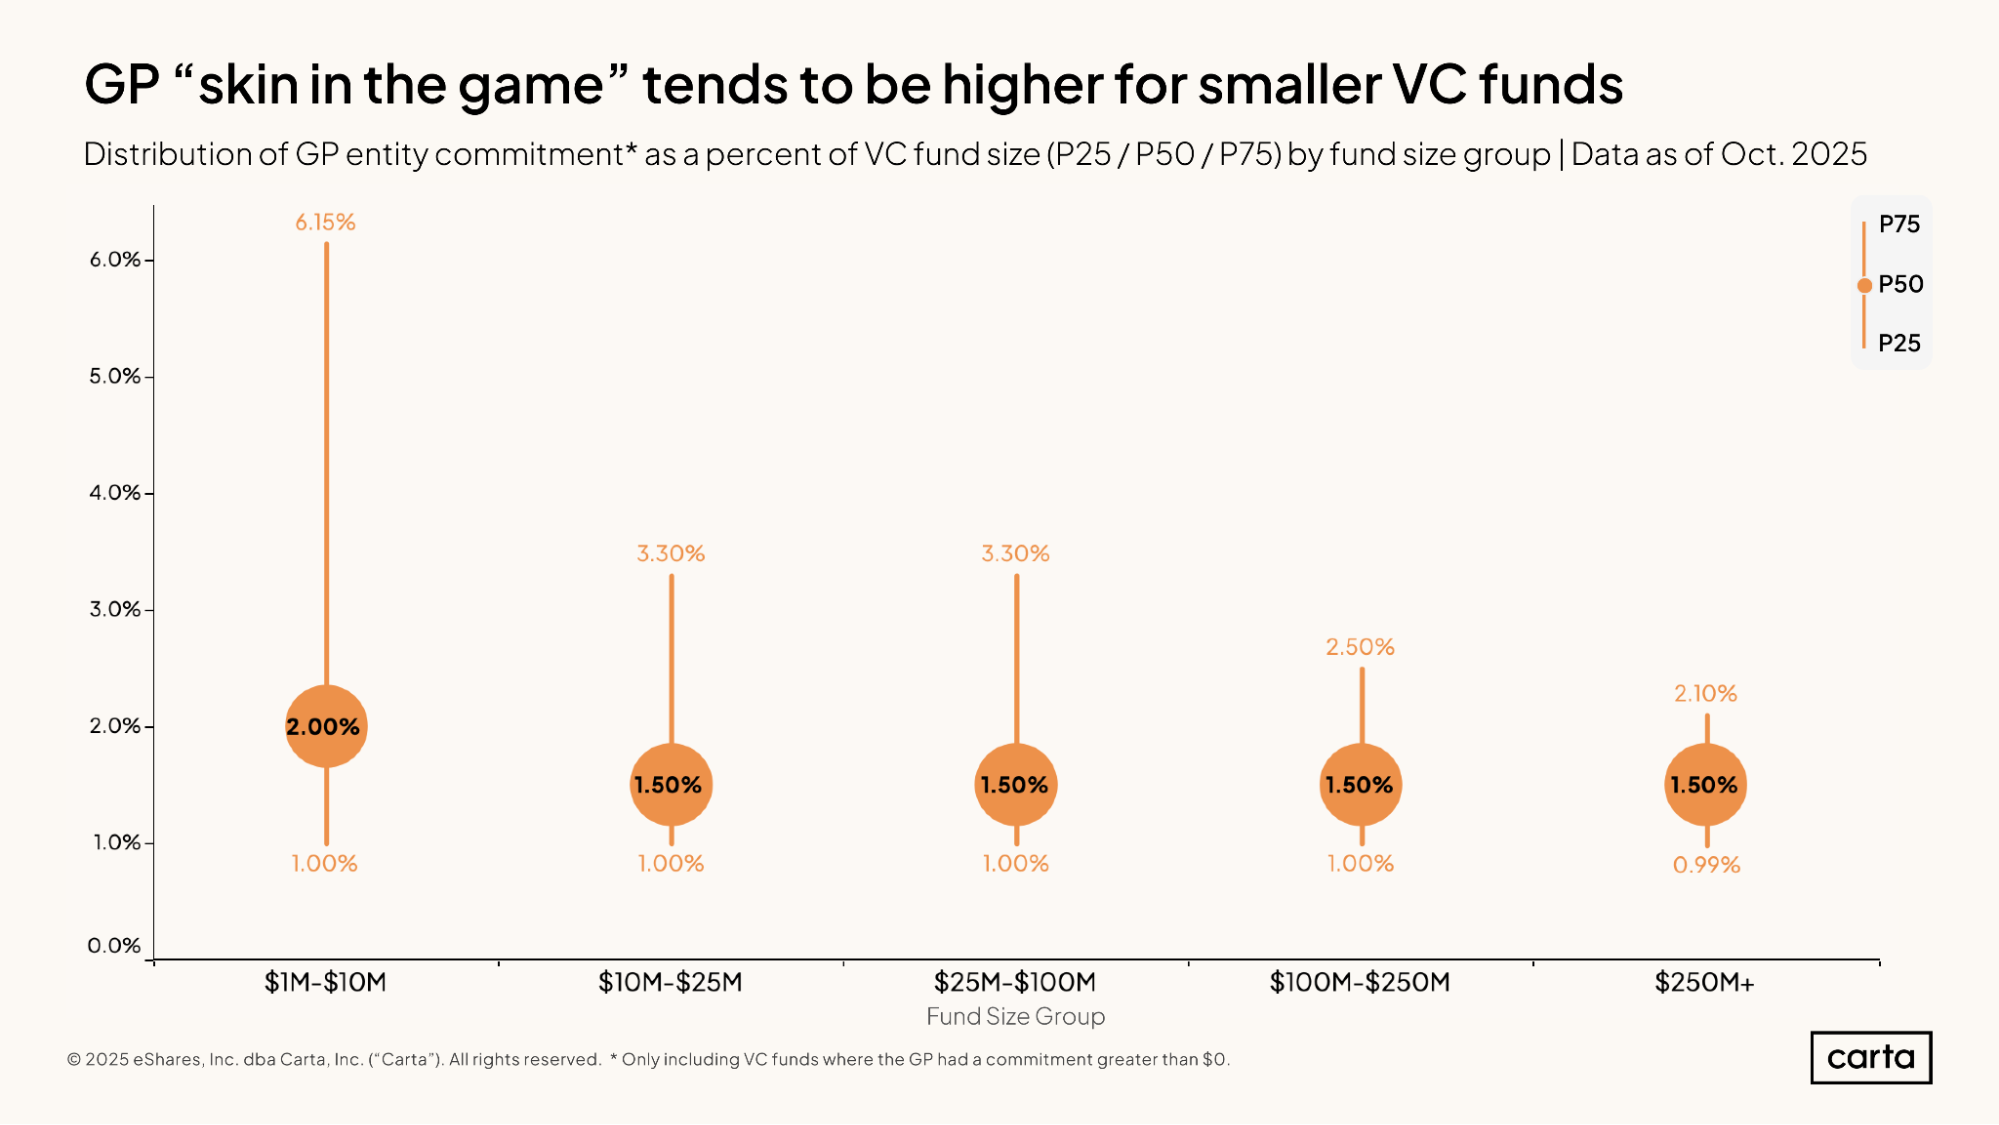
GPs managing smaller venture funds tend to have more skin in the game—measured by the size of their commitment as a percentage of total fund size—than GPs of larger funds. Smaller funds also tend to have a much wider range of common GP commitment sizes.
For instance, the median GP entity commitment on Carta among funds between $1 million and $10 million is 2% of the total fund size, while the 75th percentile for GP commitment is 6.15% of fund size. For funds between $25 million and $100 million, the median GP commitment drops to 1.5% of fund size, while the 75th percentile is 3.3%. At the upper end of the spectrum, there’s even less variability: The median GP commitment at VC funds larger than $250 million is 1.5%, and the 75th percentile is 2.1%.
On an absolute basis, however, larger funds typically have much larger GP commitments. For a $5 million fund, 2% of the fund (the median for vehicles of this size) equates to a commitment of $100,000. For a $250 million fund, a 1.5% commitment would total $3.75 million.
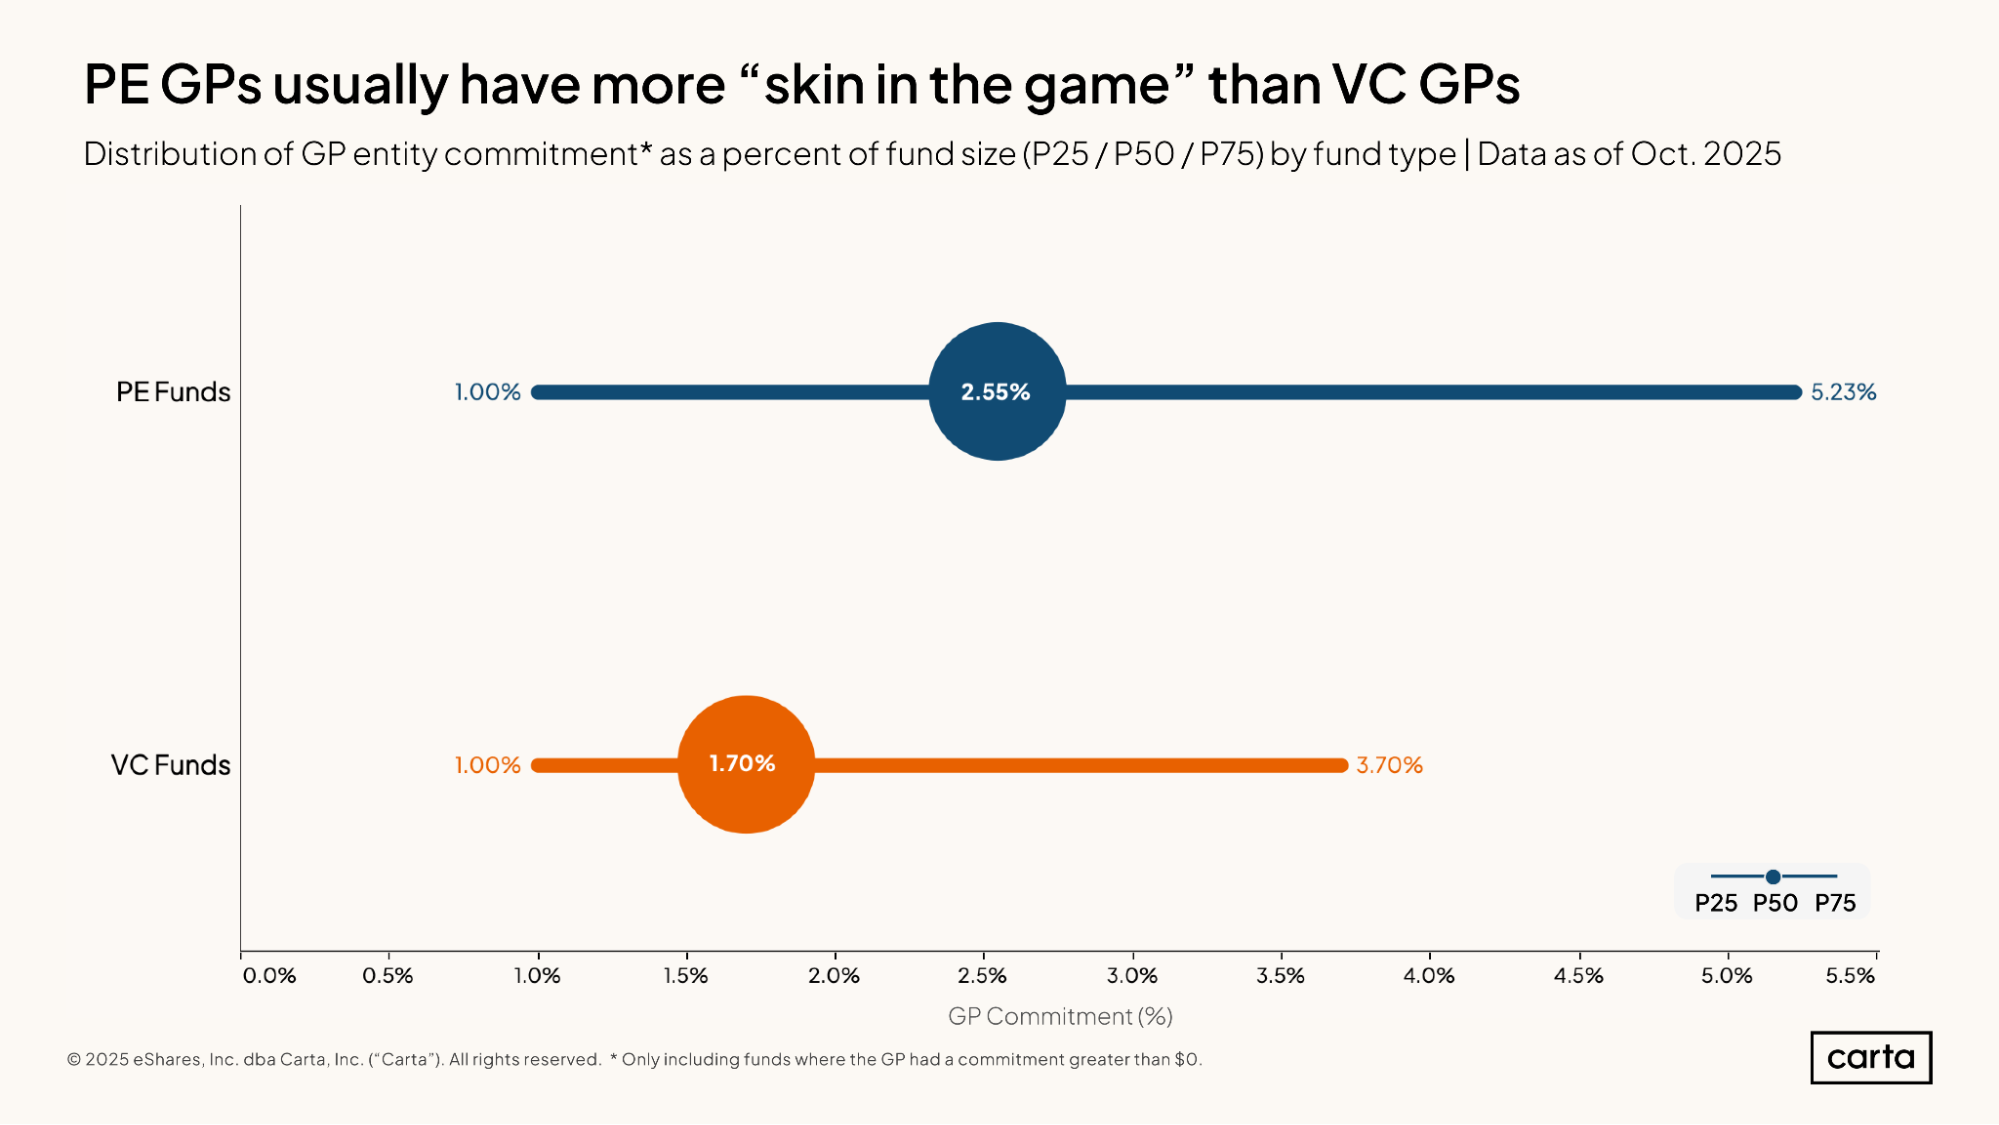
Private equity fund managers typically have more skin in the game than their peers in venture capital. Across venture funds of all sizes, the median GP entity commitment totals 1.7% of overall fund size. In private equity, the median GP commitment is 50% larger, at 2.55%.
For both VC and PE funds, the sizes of GP commitments follow a right-tailed distribution, with some managers having substantially more skin in the game than the median. But this distribution is wider in PE than in VC. The 75th percentile for skin in the game among PE funds is 5.23%, compared to 3.7% for VC funds.
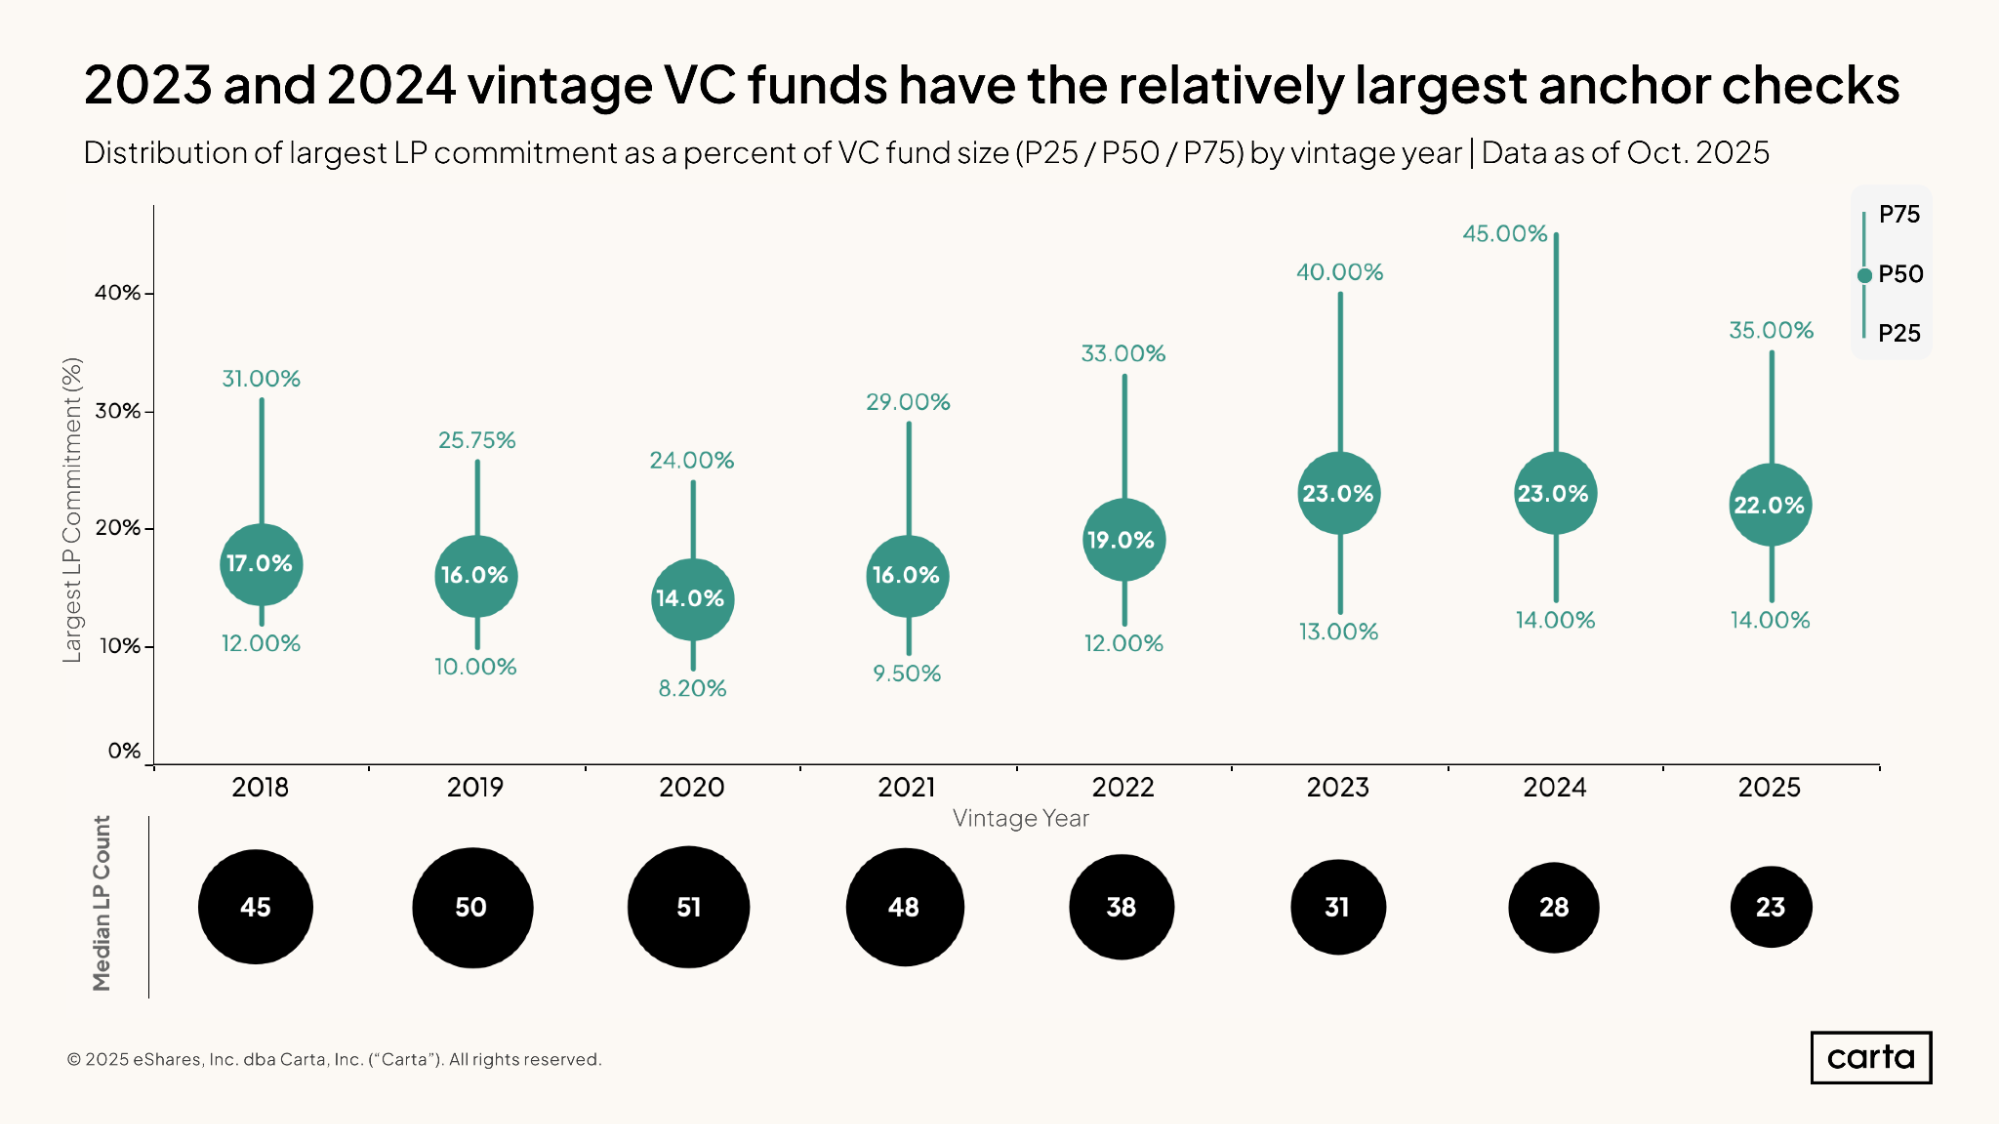
Over the past few years, the typical anchor check for VC funds—defined as the largest single check written by any LP—has gotten bigger. From 2023 onward, the median anchor check has accounted for at least 22% of total fund size; previously, from 2018 through 2022, the median anchor check was never more than 19% of a fund’s overall capital.
This increase in the size of anchor checks has coincided with a decrease in the typical number of LPs committing capital to a fund. For the 2025 vintage, the median VC fund had just 23 LPs, less than half of the median LP count from four years before. When GPs find it more difficult to recruit investors to a fund, they may ask some of those LPs who do sign on—including the anchor LP—to make proportionally larger commitments.
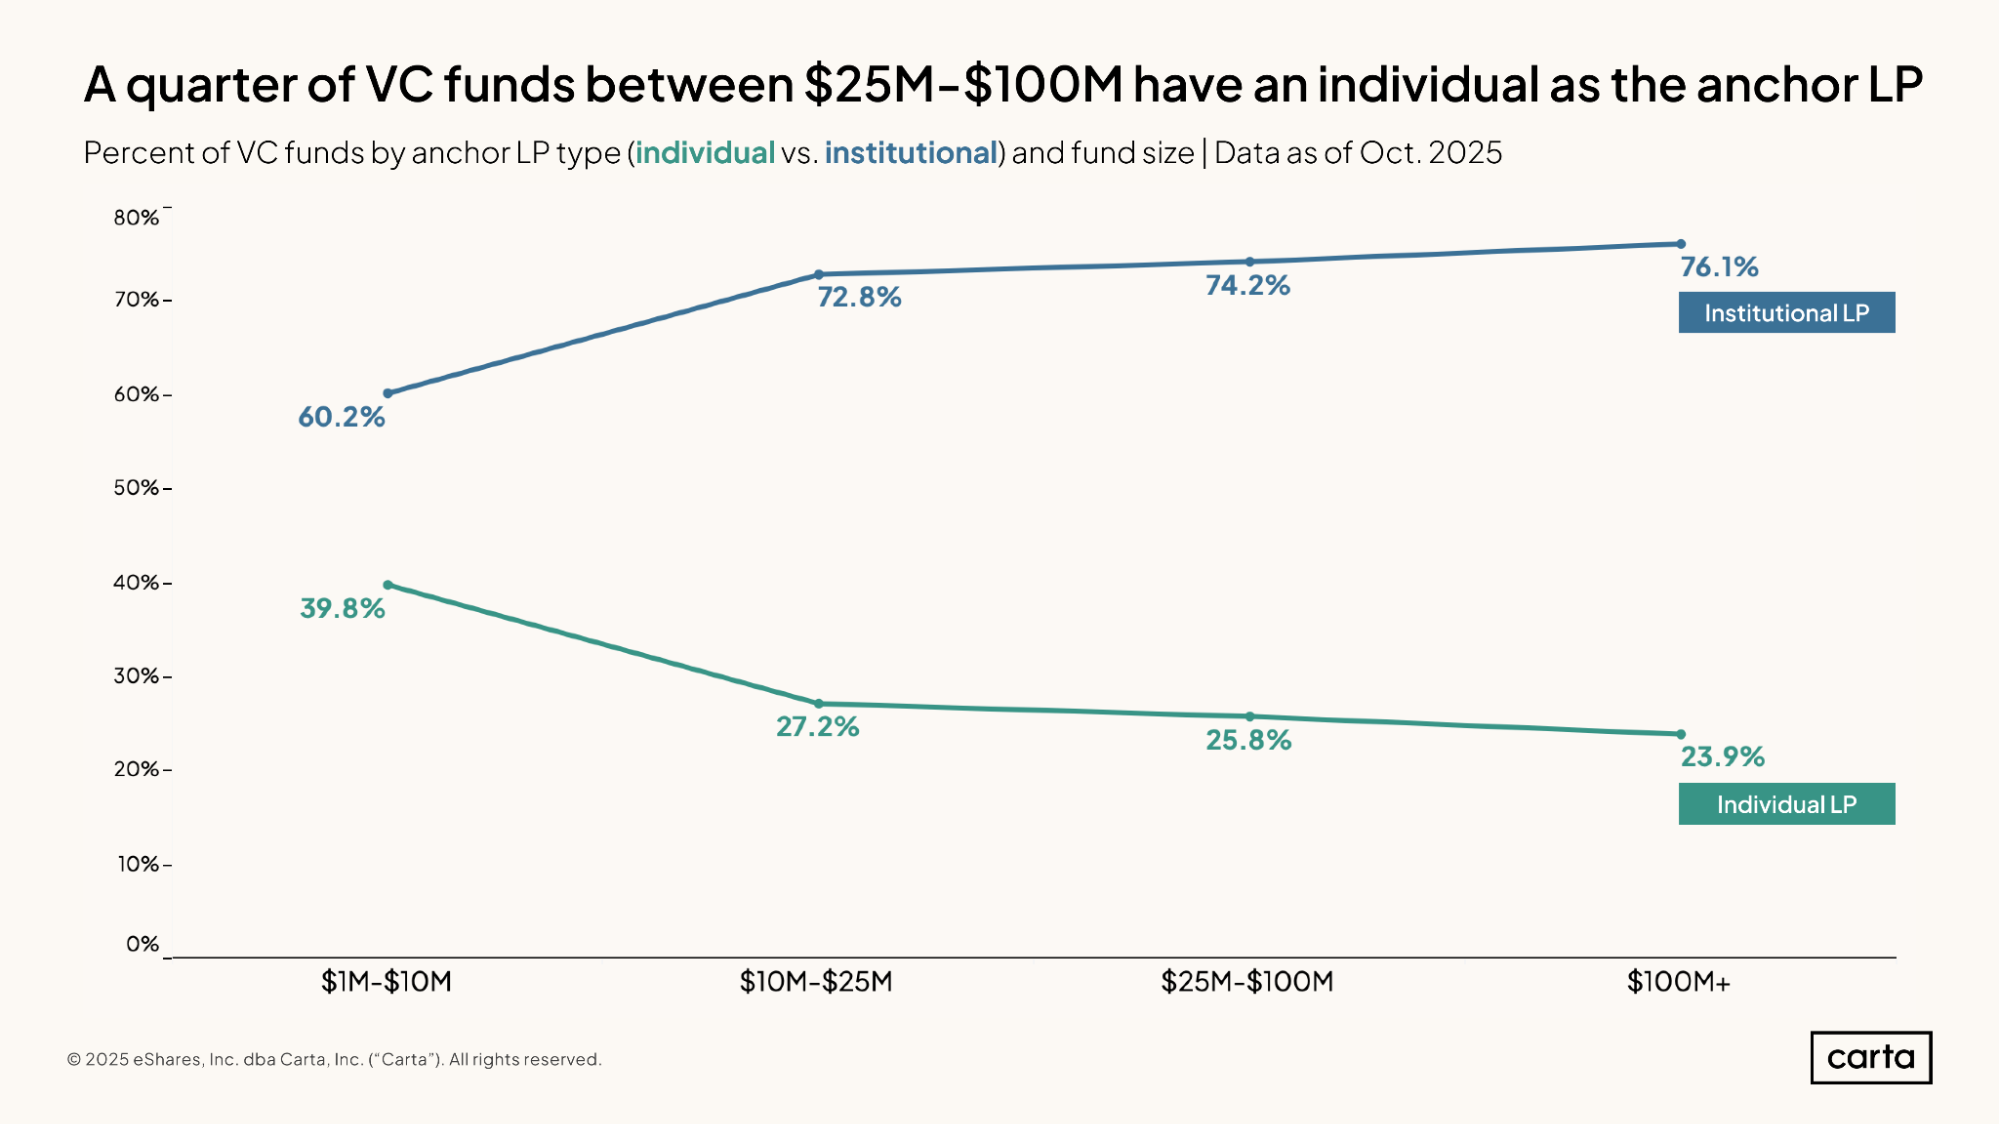
Across venture funds of all sizes on Carta, most anchor LPs are institutional investors. But individual investors also make up a substantial segment of anchor LPs—and among smaller fund sizes, individual anchor LPs become more common.
Among funds between $1 million and $10 million, about 60% of anchor LPs are institutions, and about 40% are individuals. In every other size bucket shown here, at least 70% of anchor LPs are institutional investors, and fewer than 30% are individuals. Individual investors typically manage smaller sums of capital than large institutions, so it makes sense that individuals are more likely to be anchor LPs in funds that require a smaller capital outlay.
Capital calls and contributions
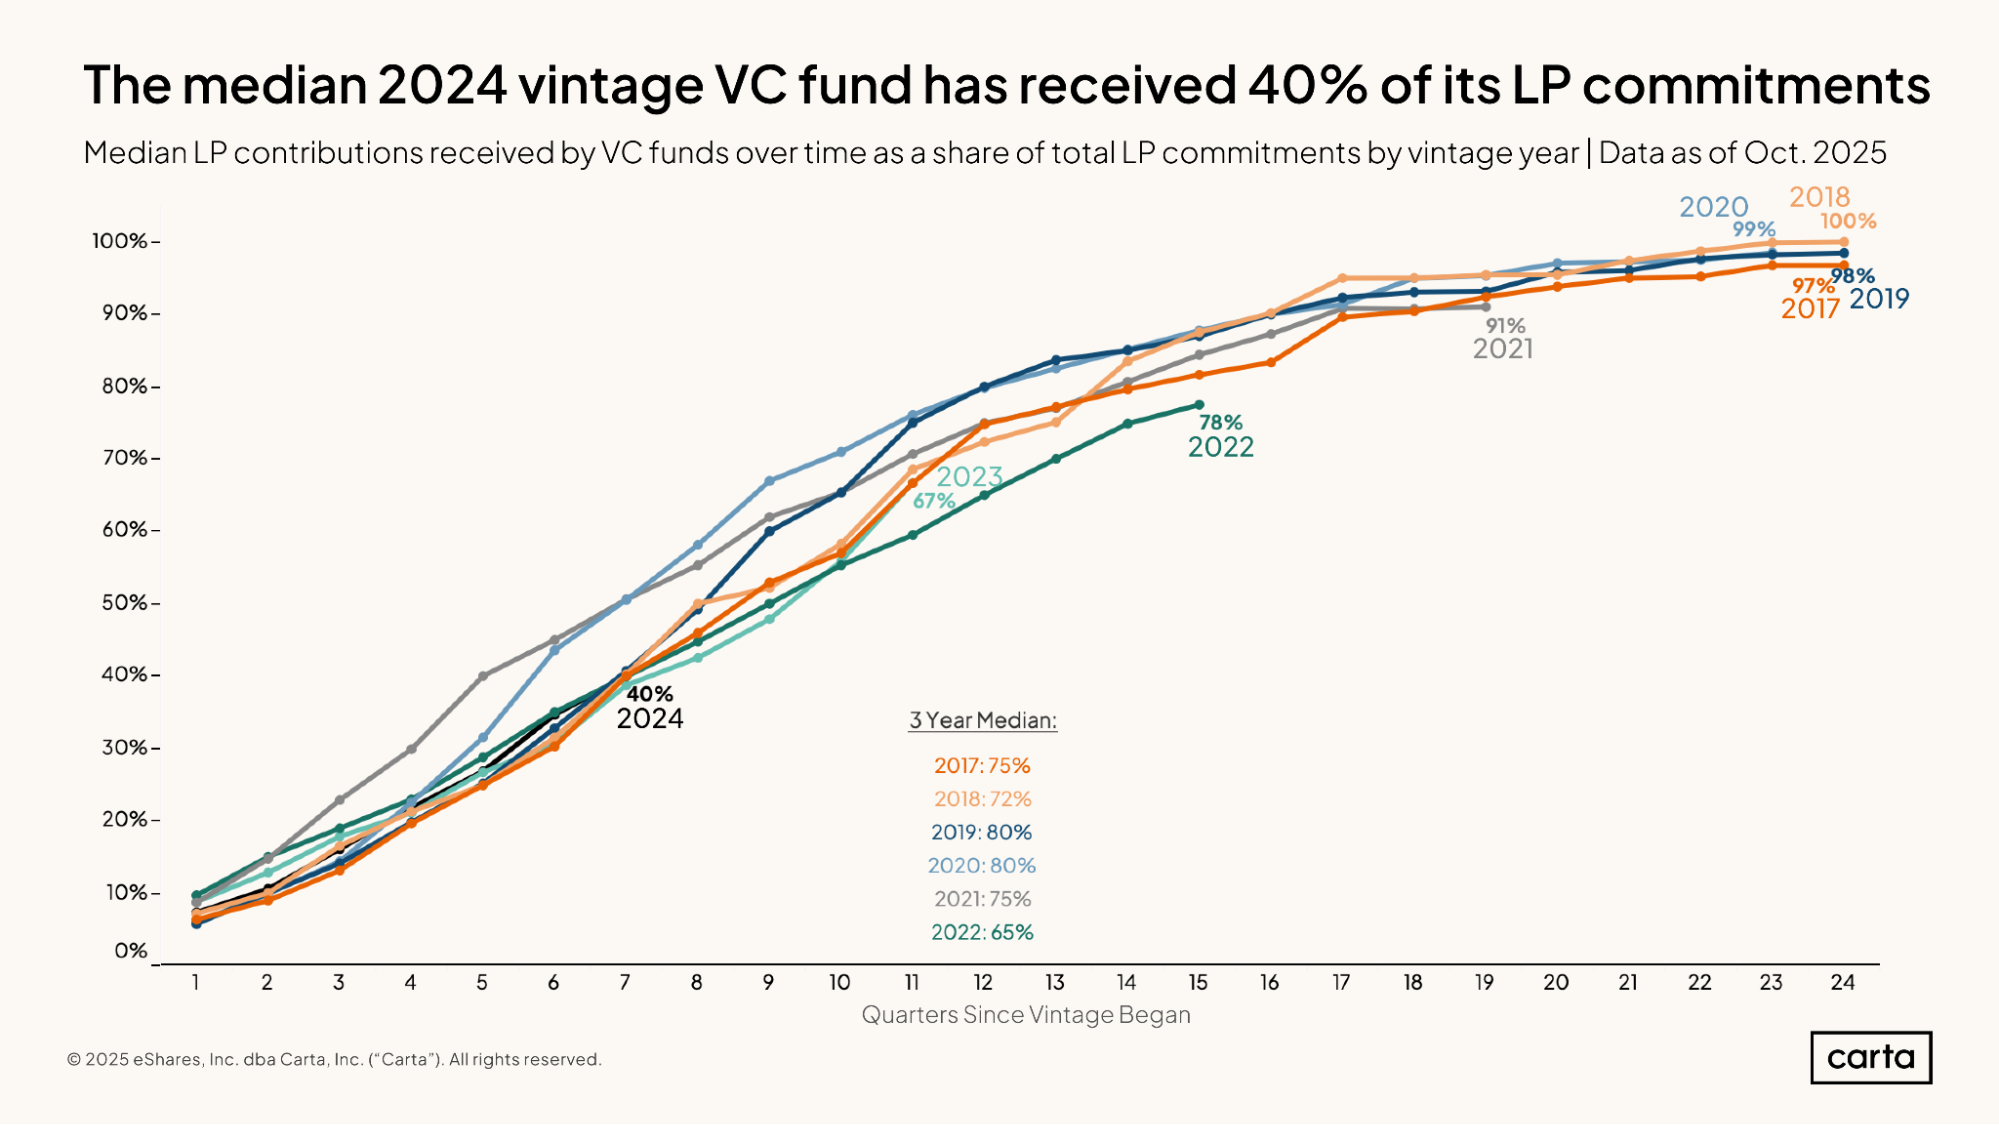
After six years (or 24 quarters) of active management, the median venture fund from each of the 2017, 2018, and 2019 vintages had received at least 97% of the capital that was initially committed by LPs. In general, the pace of capital calls follows a roughly similar pattern across all recent vintages. But a few exceptions stand out.
Both the 2020 and 2021 fund vintages had an accelerated rate of capital calls during their first two years of management. This reflects the torrid investing environment of the early 2020s, when VCs were making deals and deploying capital at record rates. The median fund from 2020 and 2021 had already received about 40% of its total committed capital from LPs after six quarters of management, compared to a typical rate of about 30% at the same time for other recent vintages.
Conversely, the median fund in the 2022 vintage has been calling capital at a slower rate than any other recent vintage, with 78% of committed capital received after 15 quarters of management. Again, this figure is indicative of the broader investment environment: Venture dealmaking began to slow down considerably in mid-2022, leading many fund managers to be more conservative about the rate of their investments, and thus of their capital calls.
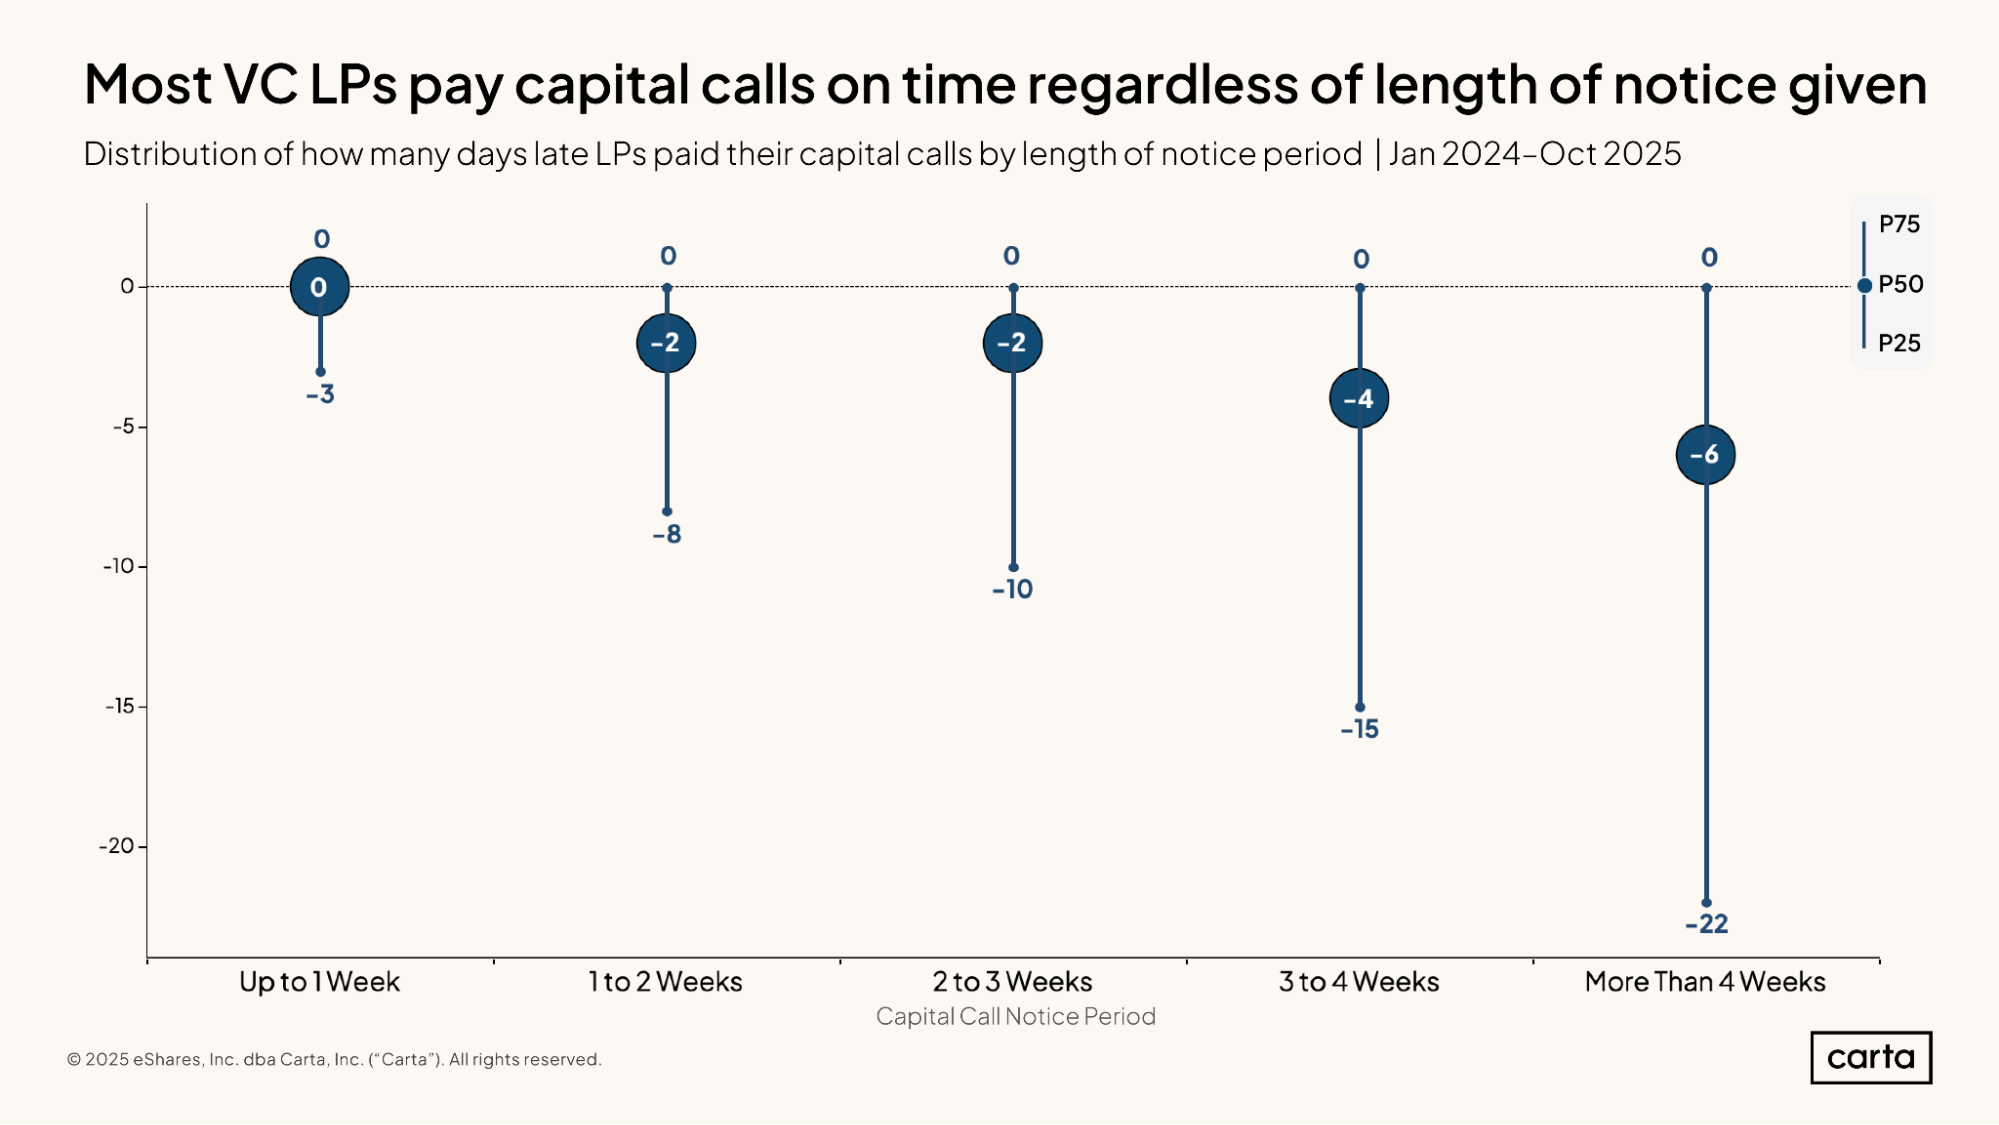
Capital calls issued by VC fund managers come with a deadline. Most of the time, LPs meet that deadline, regardless of how quick the requested turnaround.
If the notice period for a capital call is somewhere between two and three weeks, for instance, the median LP provides that capital two days before the GP’s deadline, while 25% of LPs do so at least 10 days before the deadline. When the notice period is longer than four weeks, the median LP fulfills the request six days before the due date, and 25% of LPs do so at least 22 days before the deadline.
Naturally, the longer a notice period is, the more opportunity there is for LPs to pay early. It is noteworthy, though, that shorter notice periods aren’t strongly associated with late payments. Regardless of the length of the notice period, the 75th percentile for LP response time is zero days, meaning they fulfill the capital call on the same day it is due.
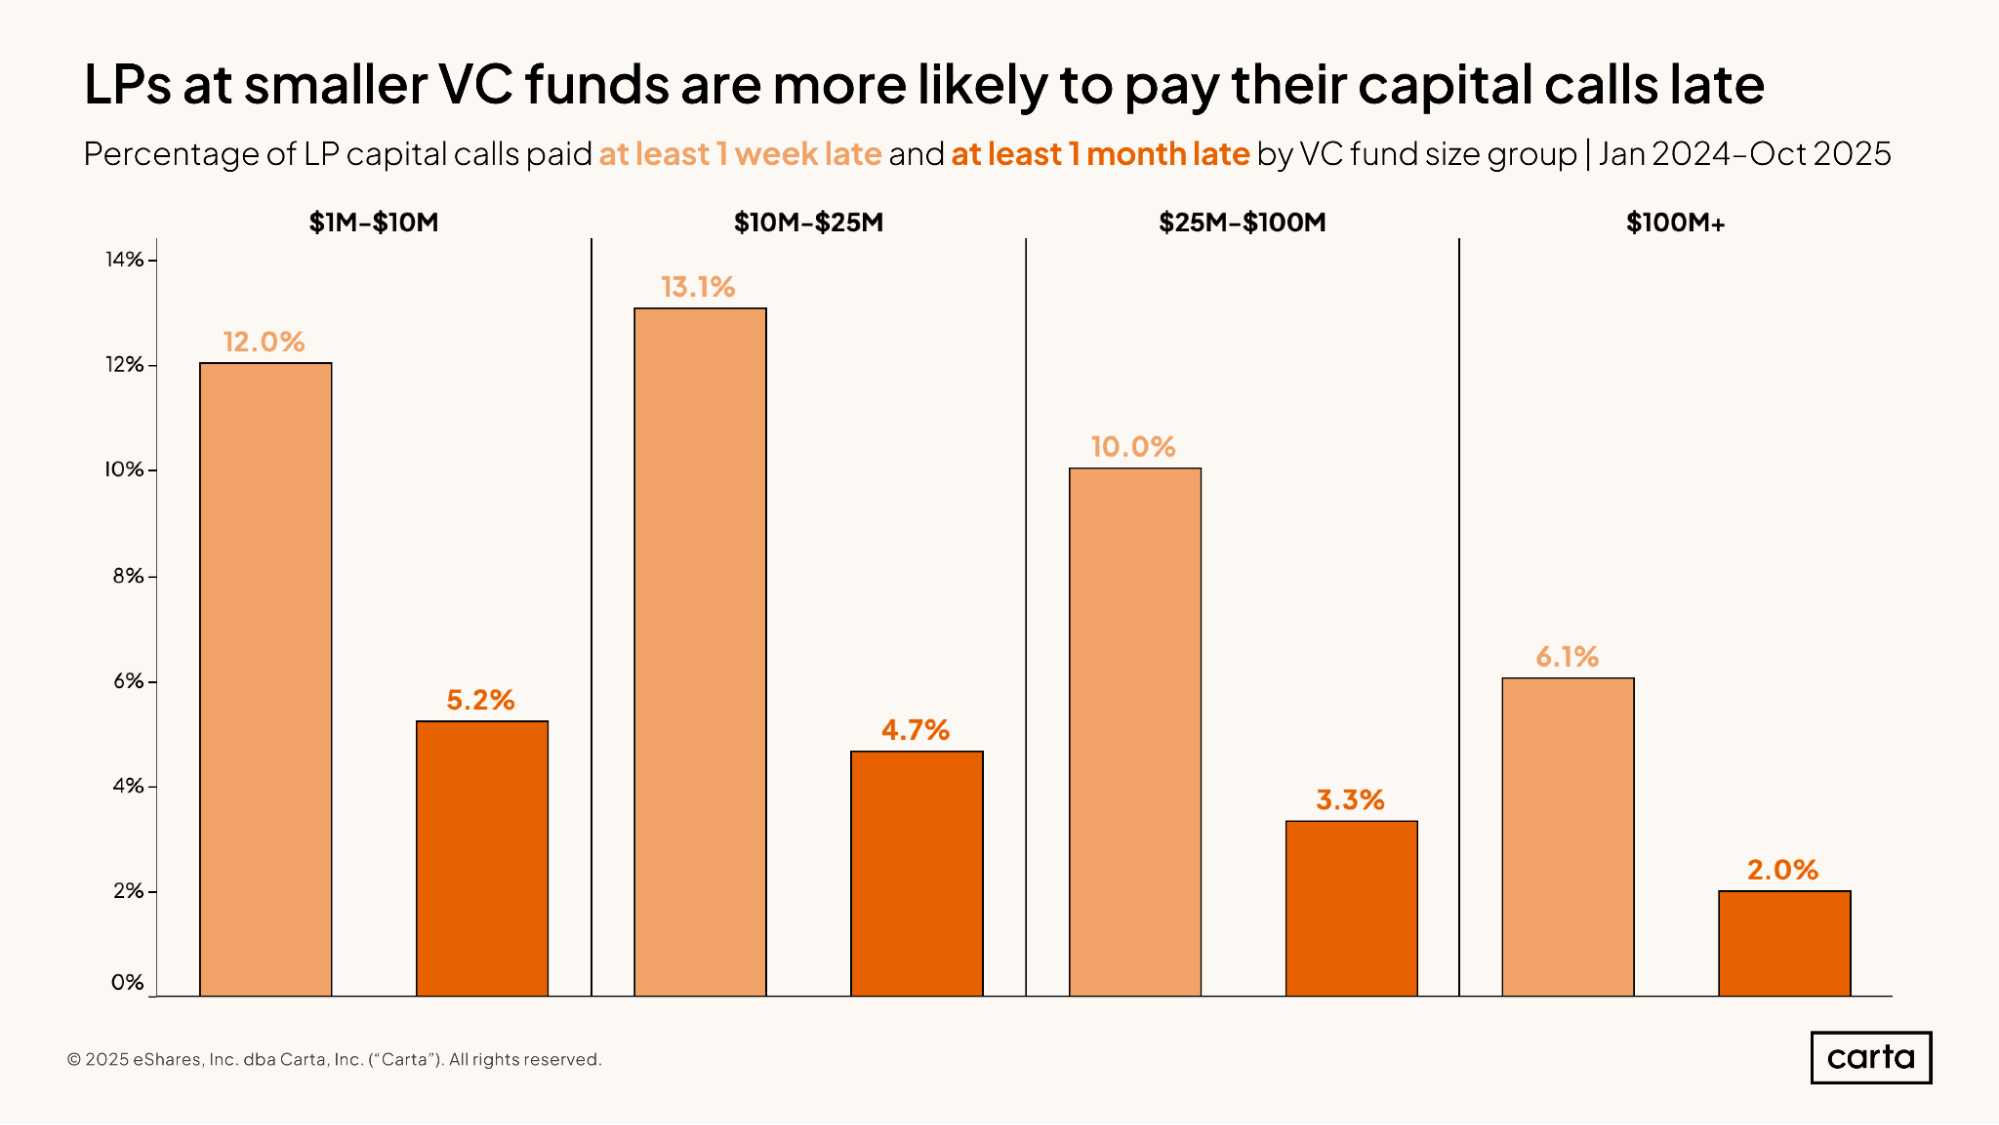
While the vast majority of LPs fulfill their requested capital calls within the notice period provided by the GP, some do not. Late fulfillment is more common at smaller funds than larger ones.
Among venture funds with between $1 million and $10 million in commitments, 12% of LPs are at least one week late in fulfilling their capital calls, and 5.2% are at least a month late. These rates of late payment decline by about half among venture funds with more than $100 million in commitments, with 6.1% of capital calls paid at least one week late and just 2% coming in at least a month post due.
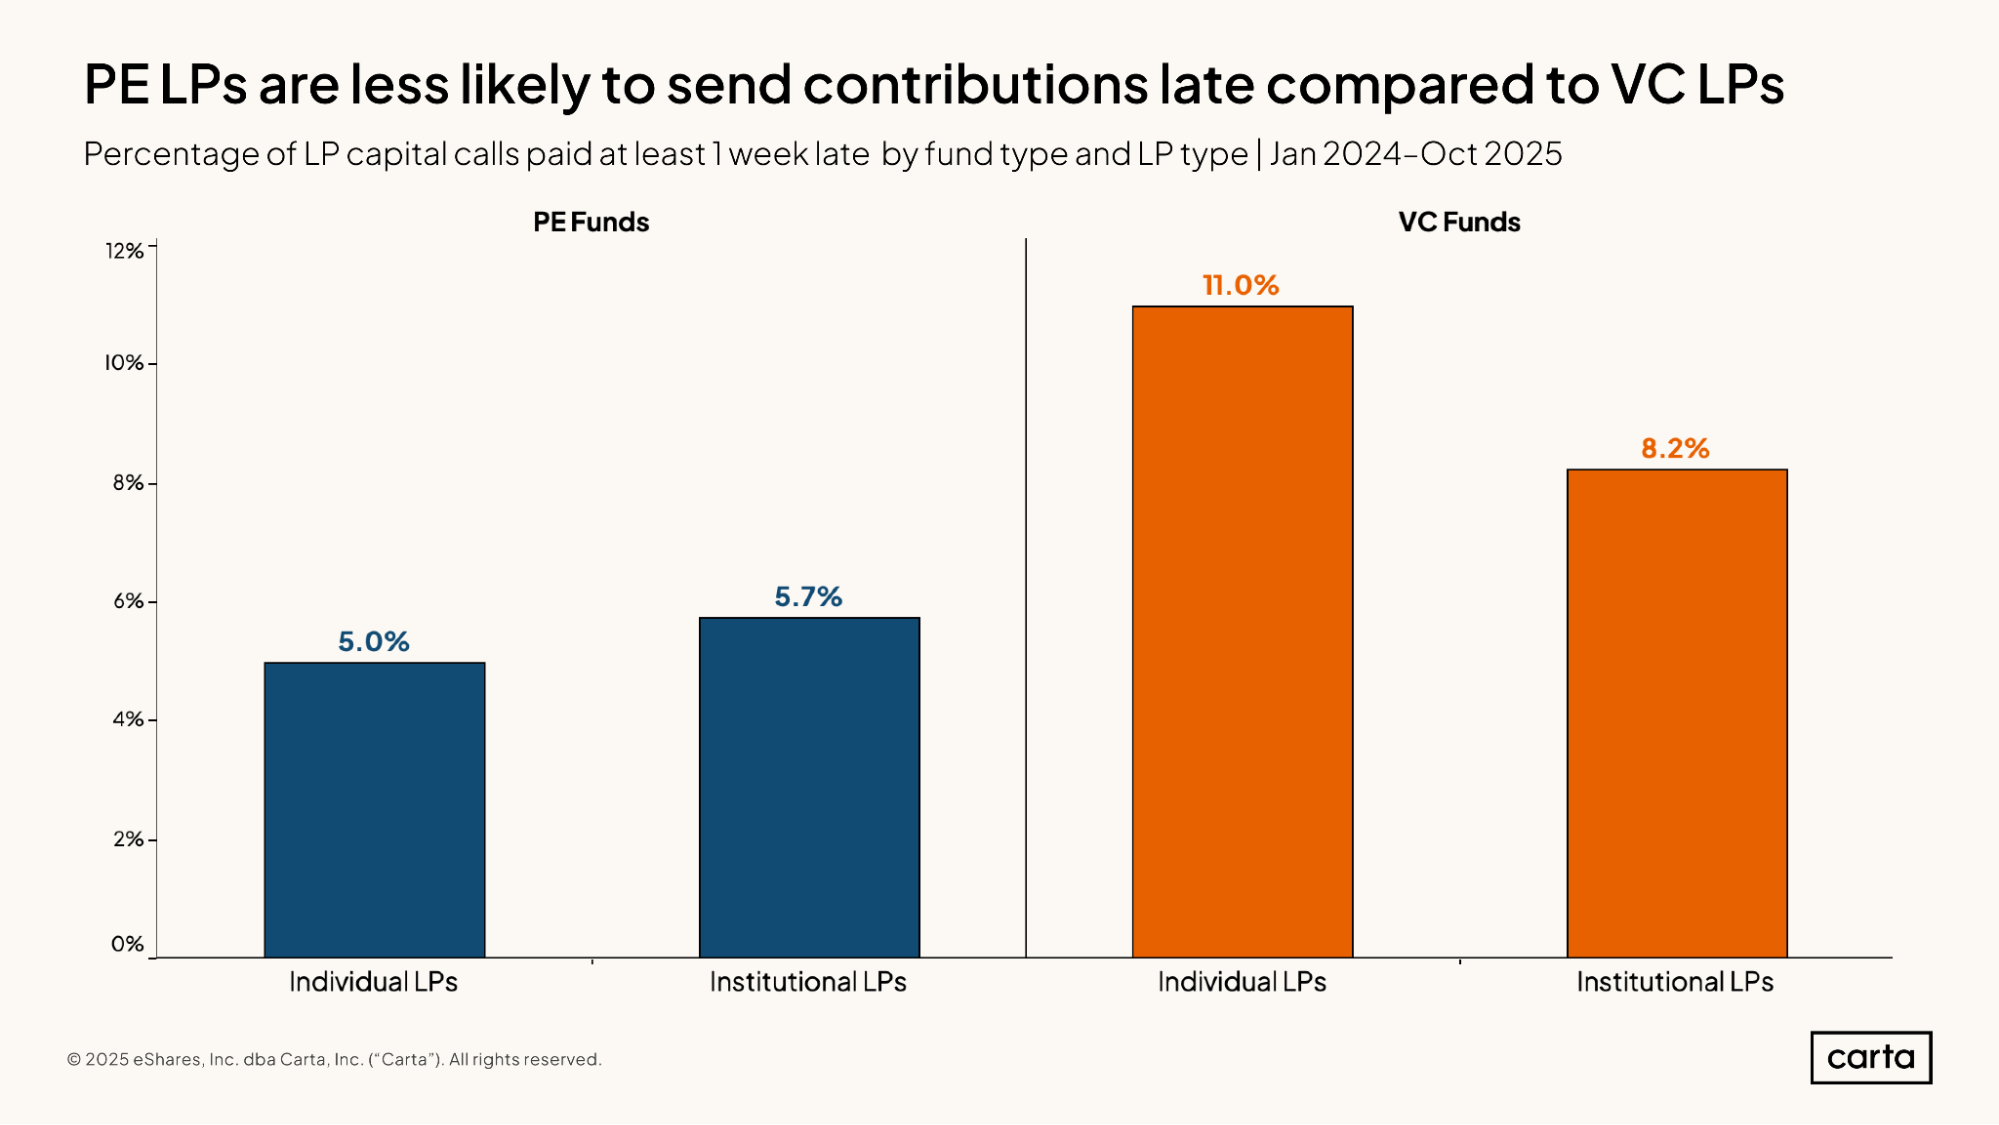
LPs in venture capital funds are more likely to be late in meeting capital calls than LPs in private equity funds. The difference is particularly stark among individual investors. Individual LPs in venture funds are at least one week late in meeting capital calls about 11% of the time, more than double the rate among individual LPs in PE funds (5%).
Among VC funds, individual investors are more likely than institutional investors to be in arrears on a capital call. Among PE funds, on the other hand, institutional LPs are slightly more likely than individuals to be late on a capital call.
Capital deployment
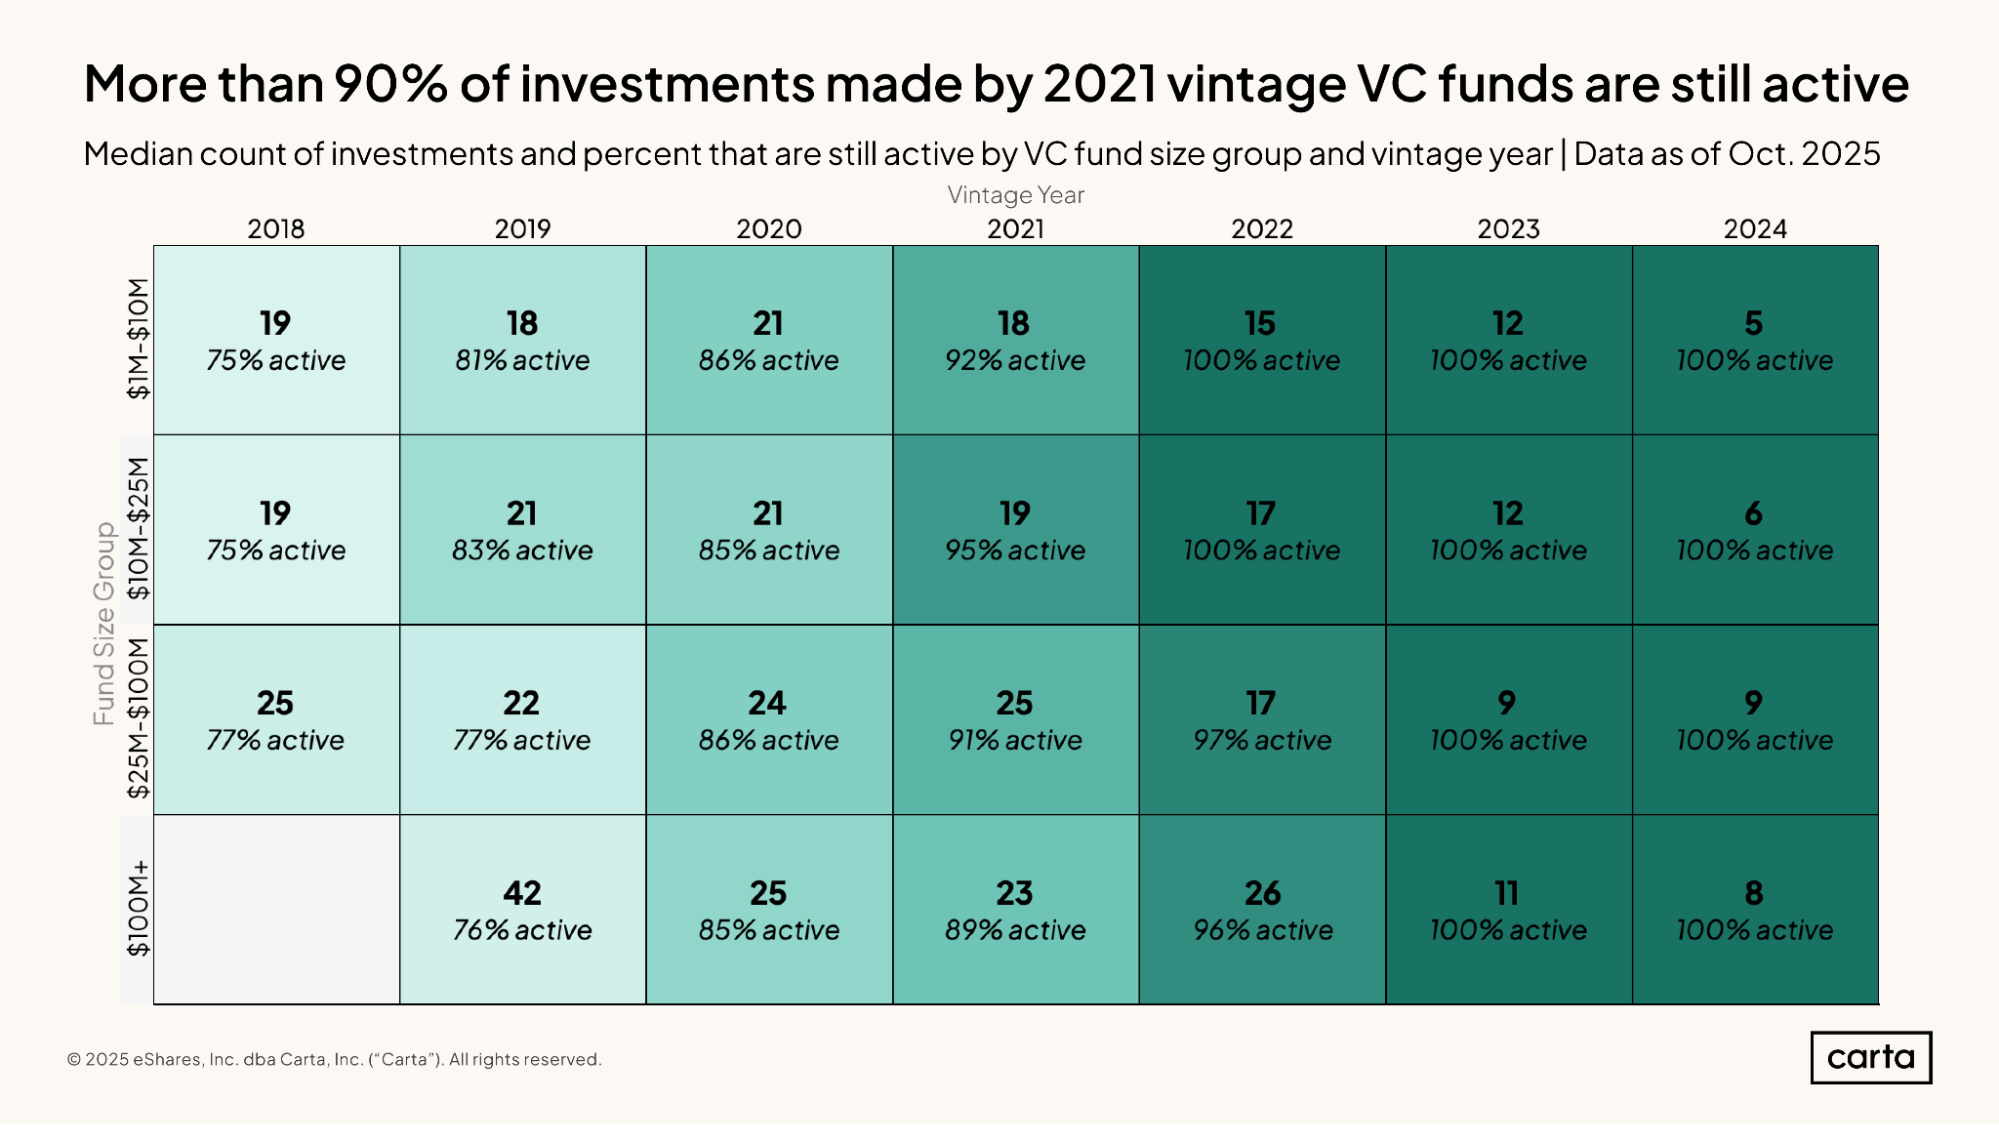
For every fund size and every recent vintage, a large majority of venture investments are still being actively managed. For example, the median fund from 2020 with at least $100 million in commitments has made 25 investments, and 85% of those investments are still active. The median fund from 2023 that’s between $1 million and $10 million in size has made 12 investments, and all of them are still active.
In some recent vintages—such as 2020, 2021, and 2023—there’s little variation in the median number of investments made across different fund sizes. In other vintages, though, there’s a significant gap. Such is the case for funds raised in 2019: The median fund from that vintage with between $1 million and $10 million in commitments has made 18 investments, while the median fund larger than $100 million has invested in 42 companies.
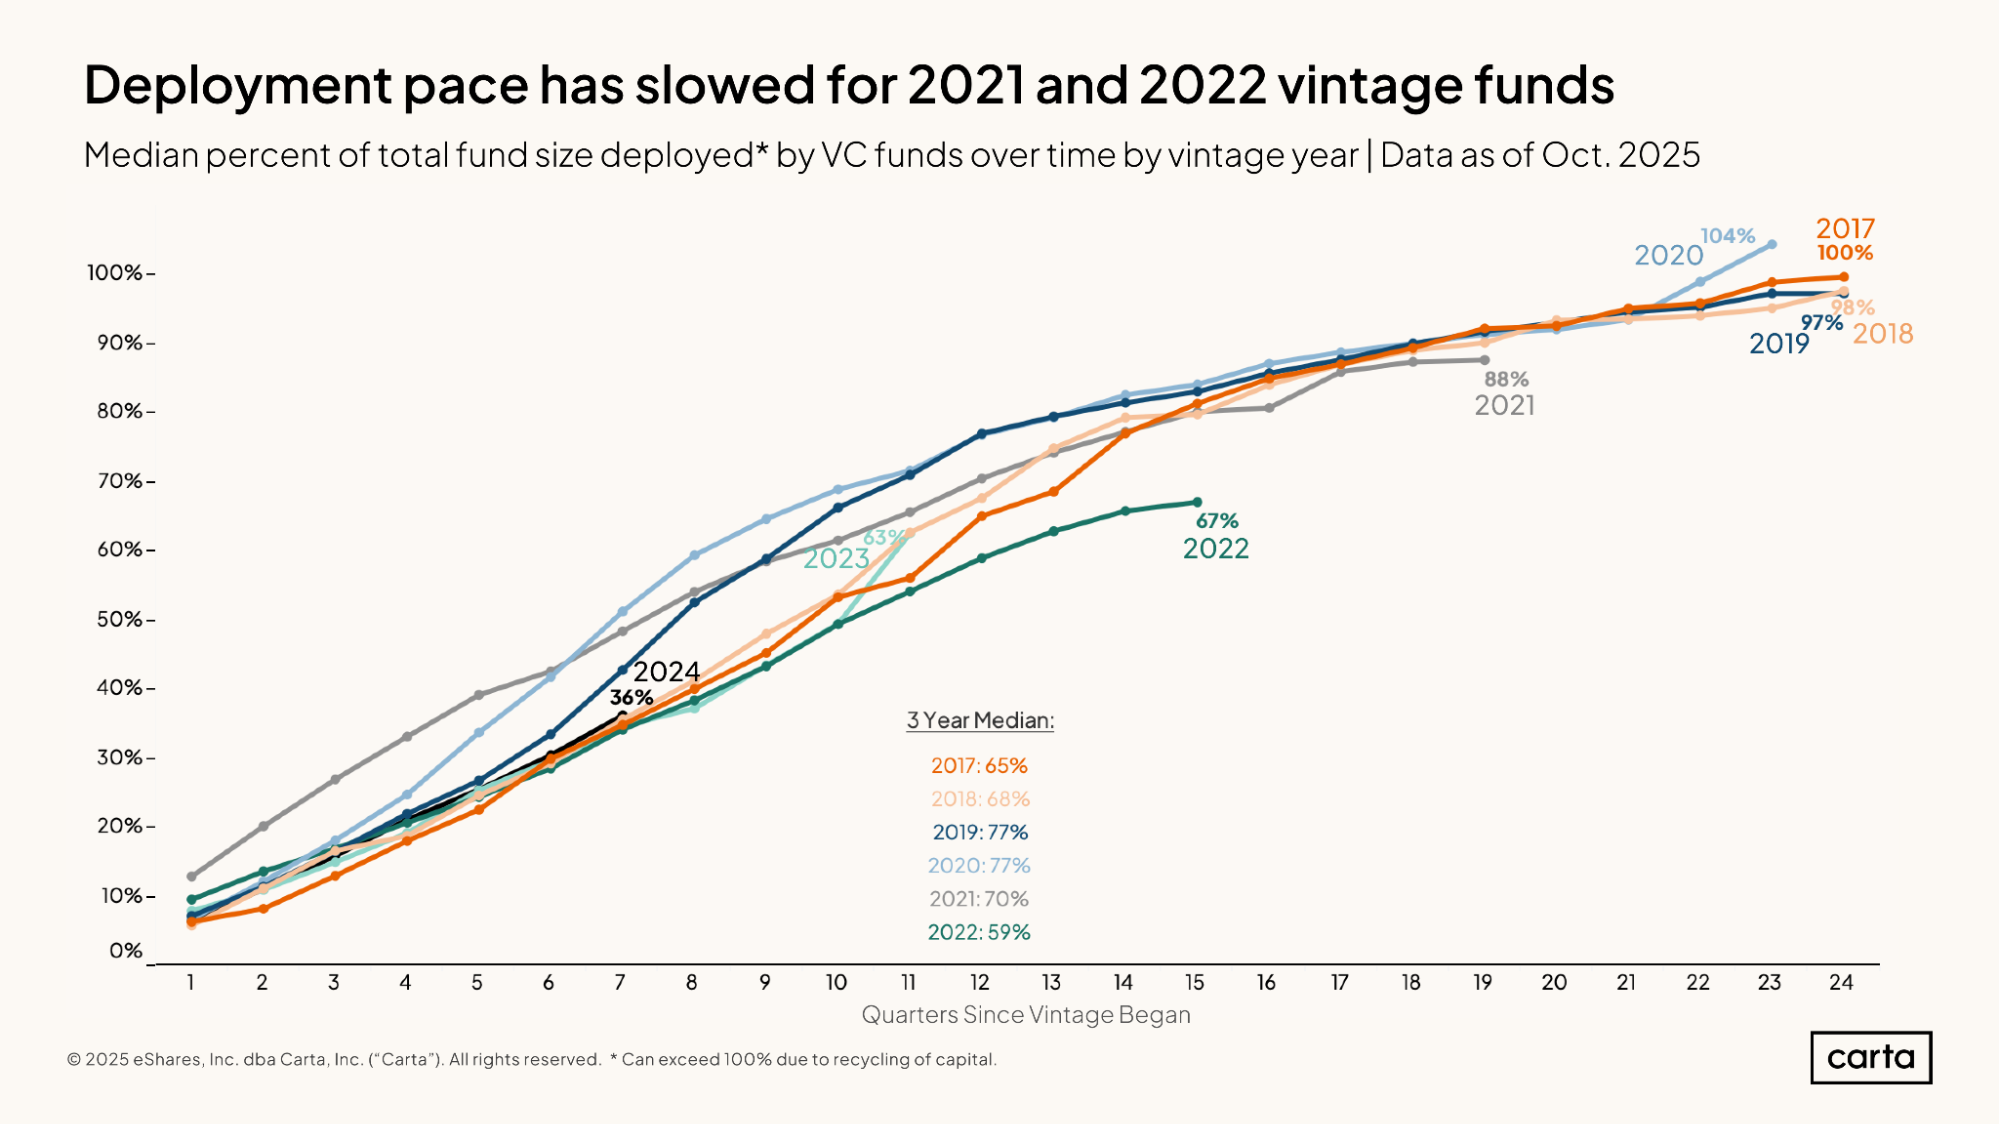
In their initial quarters of operation, the managers of VC funds closed in 2021 were deploying capital more quickly than managers in any other recent vintage. At the one-year point, the median 2021 fund had already deployed 33% of its committed capital; at that same juncture, the median fund from most other recent vintages had deployed less than 20% of available funds.
In the past few years, however, the pace of deployment for 2021 funds has slowed considerably. After 19 quarters of management—just shy of five years—the median fund from the 2021 vintage had deployed 88% of its capital, a lower figure than any vintage from the preceding four years.
As is the case for the rate of capital calls by venture funds, these recent rates of deployment have been impacted significantly by macroeconomic factors. When the 2021 vintage was deploying capital at great speed, the venture market was in the midst of a bull run marked by record-breaking deal totals and soaring valuations. The managers who closed funds that year were eager to capitalize; some managers raised new capital for the express purpose of investing in a red-hot market. Since then, dealmaking has slowed, and deployment rates have decelerated for the 2021 vintage—and for the 2022 vintage.
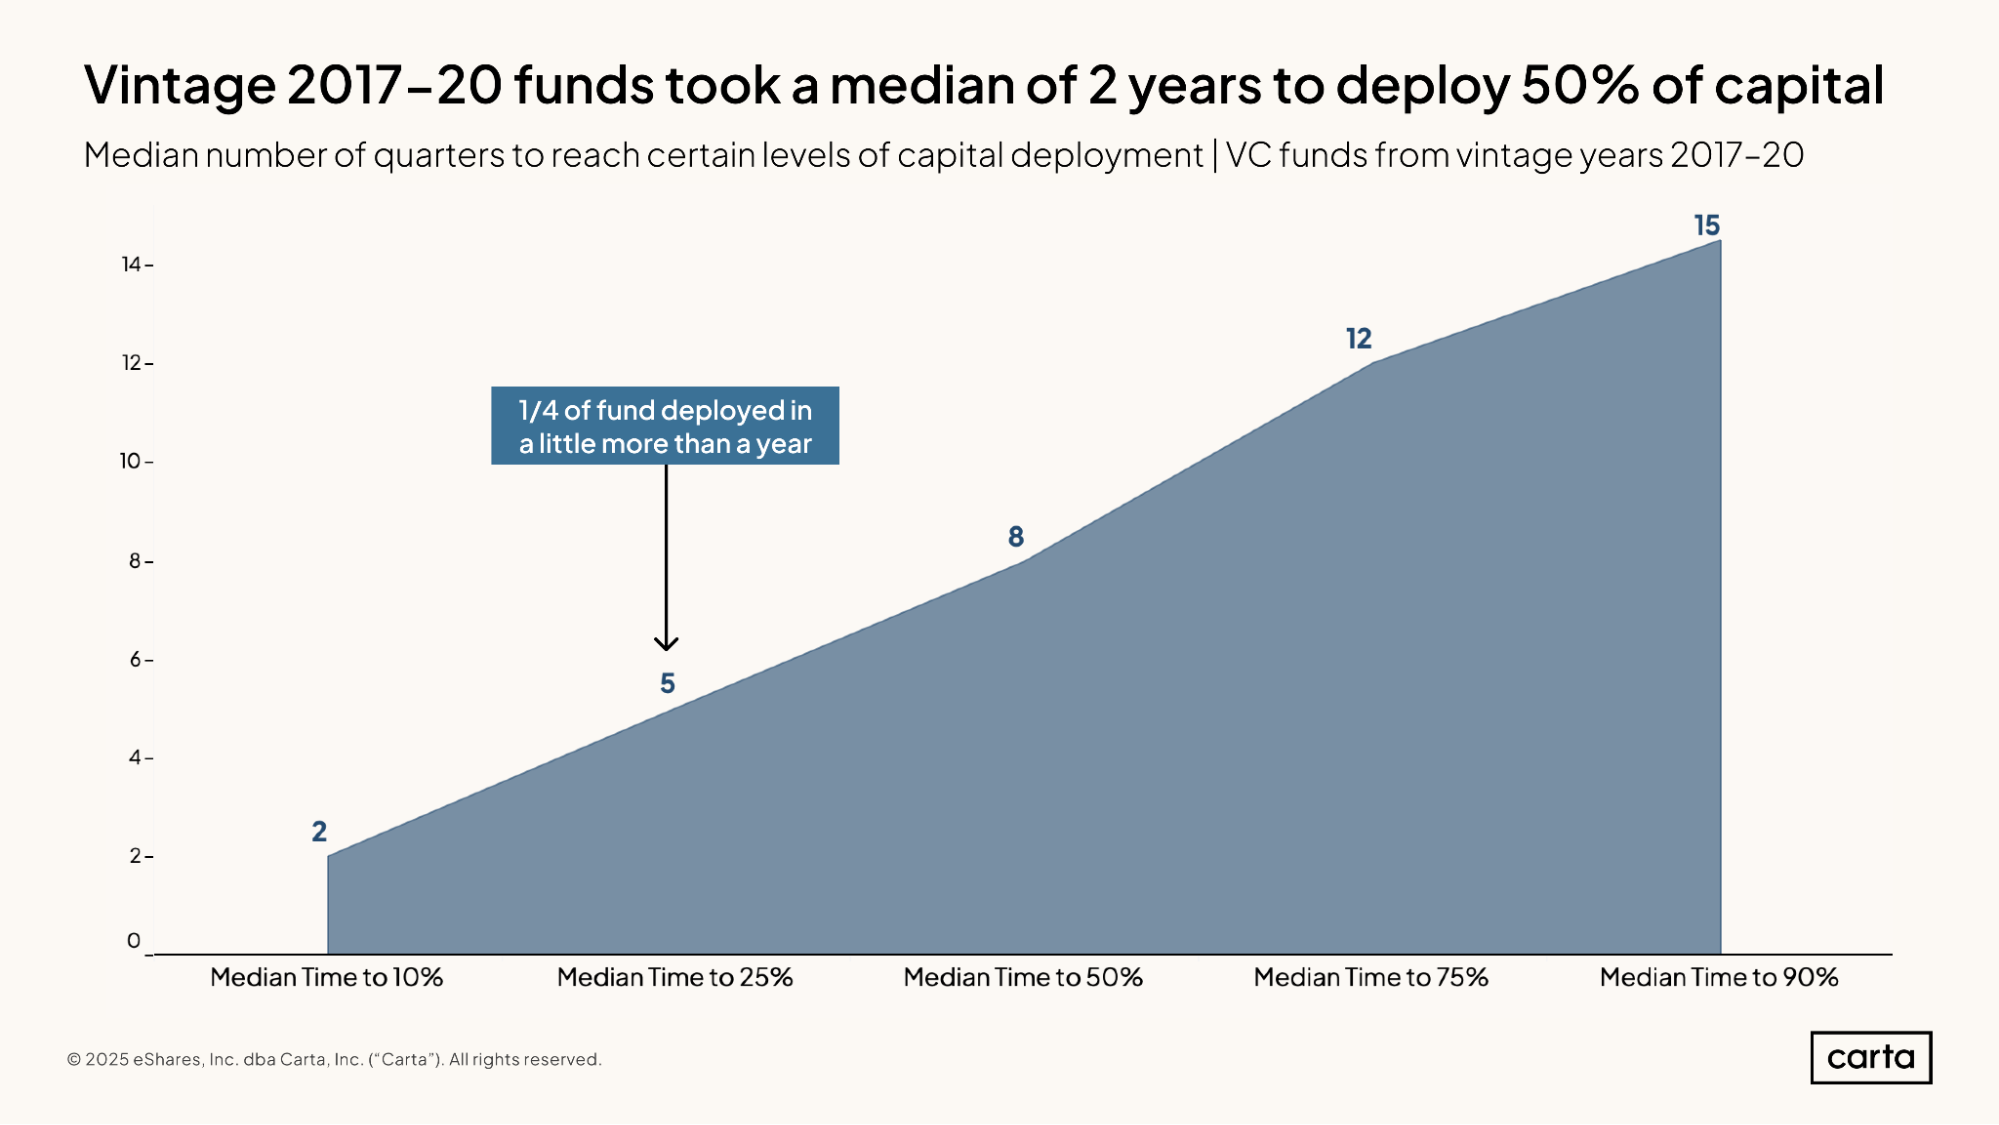
Among venture funds closed from 2017 through 2020, the rate of capital deployment has followed a fairly smooth curve, indicating a steady rate of spending by VCs. The median fund from this sample took two quarters to reach 10% deployment, five quarters to reach 25% deployment, eight quarters to reach 50%, 12 quarters to reach 75%, and 15 quarters to deploy at least 90% of its committed capital.
The standard investment period for a venture fund is five years, or 20 quarters. The funds from these four vintages, then, tended to deploy the bulk of their capital on a shorter timeline than originally planned. This pace of investment was likely hastened by the macro environment of the early 2020s, when the venture industry as a whole was deploying capital at unprecedented rates.
Management fees
The LPs in private funds typically pay management fees to the management company behind the fund. These fees go toward covering the cost of various operational expenses and firm overhead, including salaries for the fund manager, office rent, travel expenses, and more.
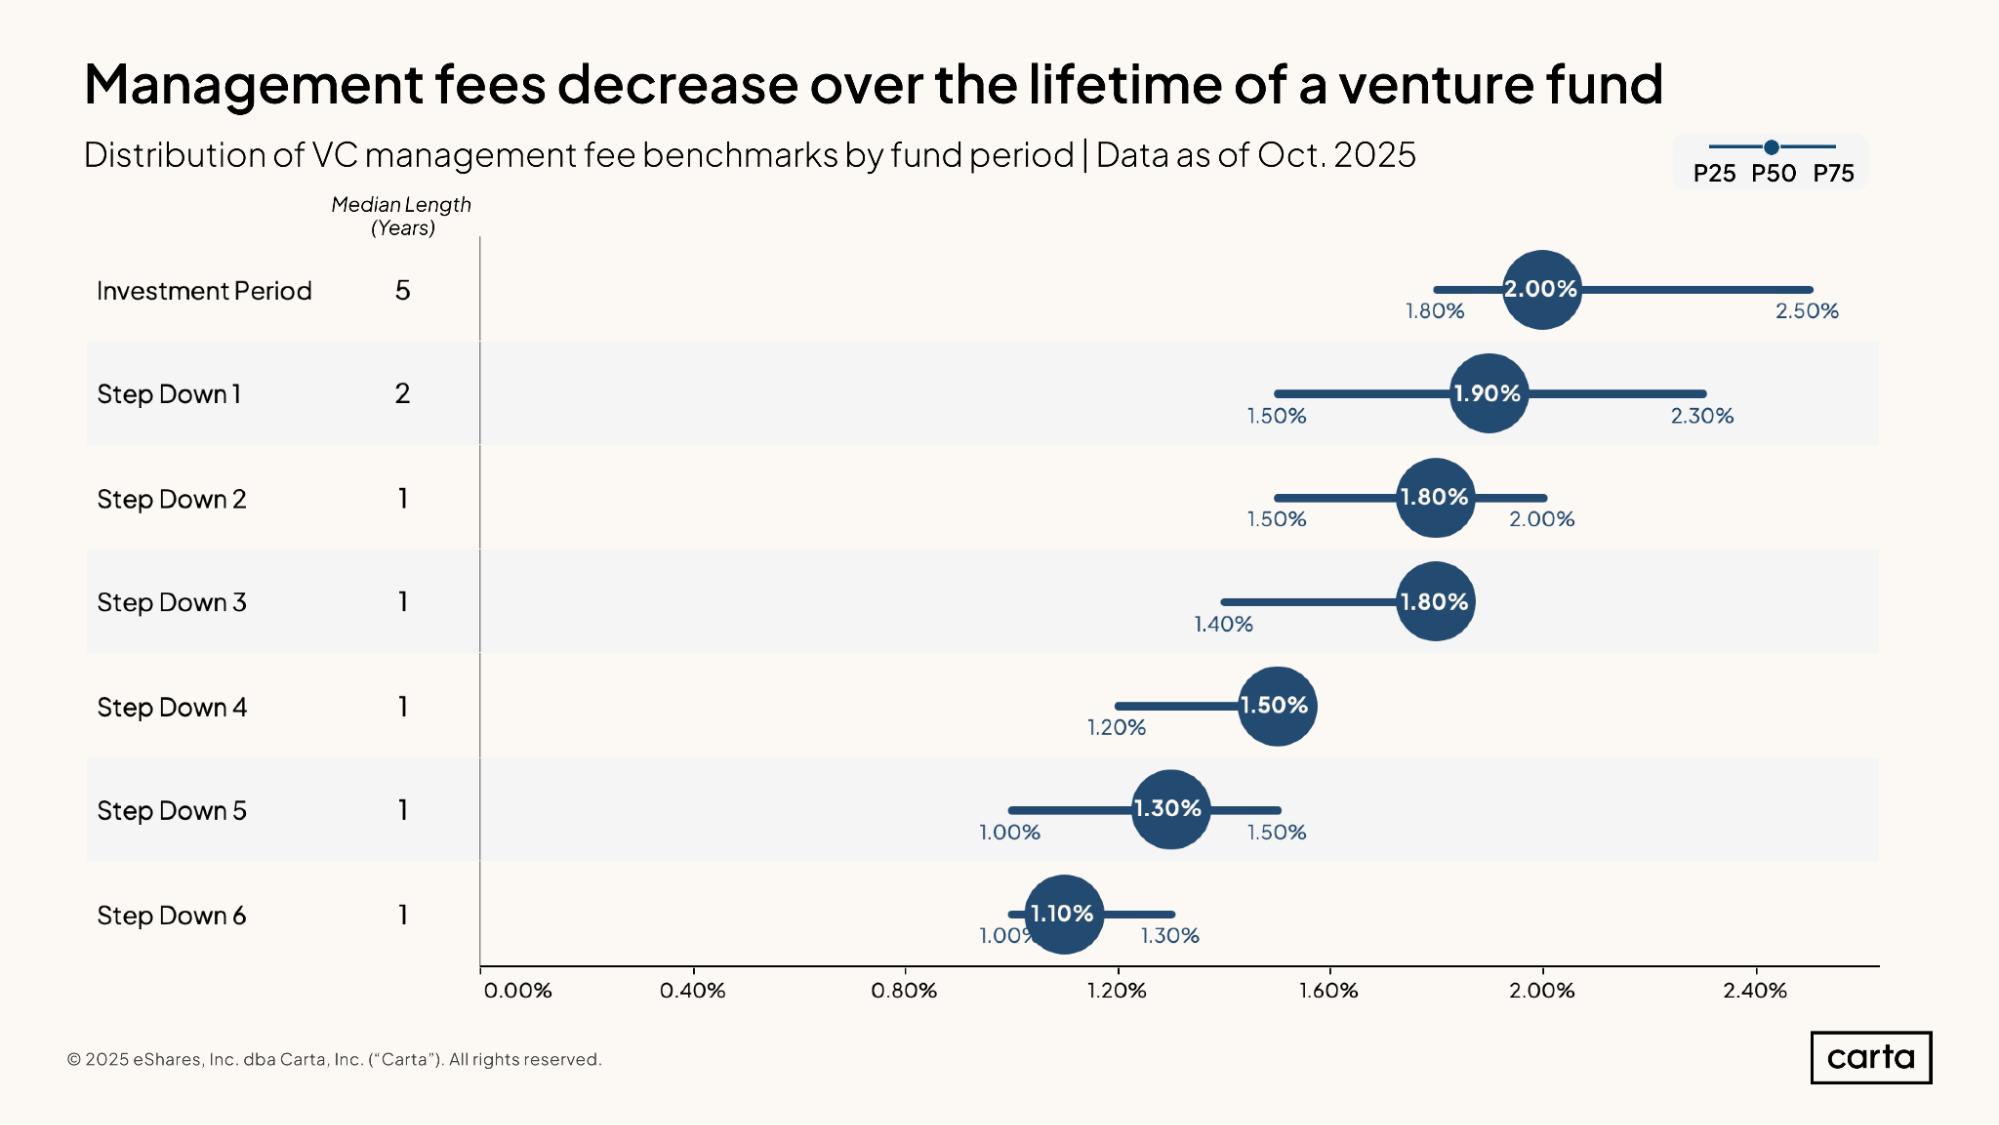
Many limited partnership agreements include provisions for reducing over time the annual management fee that LPs pay to fund GPs. These reductions, called step-downs, typically begin after the end of the fund’s investment period. Among VC funds on Carta, the median length of the investment period is five years.
For those first five years, the median management fee paid to fund GPs is 2%, in line with common industry advice. After the first step-down, the median fee drops to 1.9%. Some funds continue to have additional step-downs as time goes on. After a second step-down, the median management fee falls to 1.8%. The more step-downs that occur, the farther the typical fee drops; by the time of a sixth step-down, the median management fee is reduced to just 1.1%.
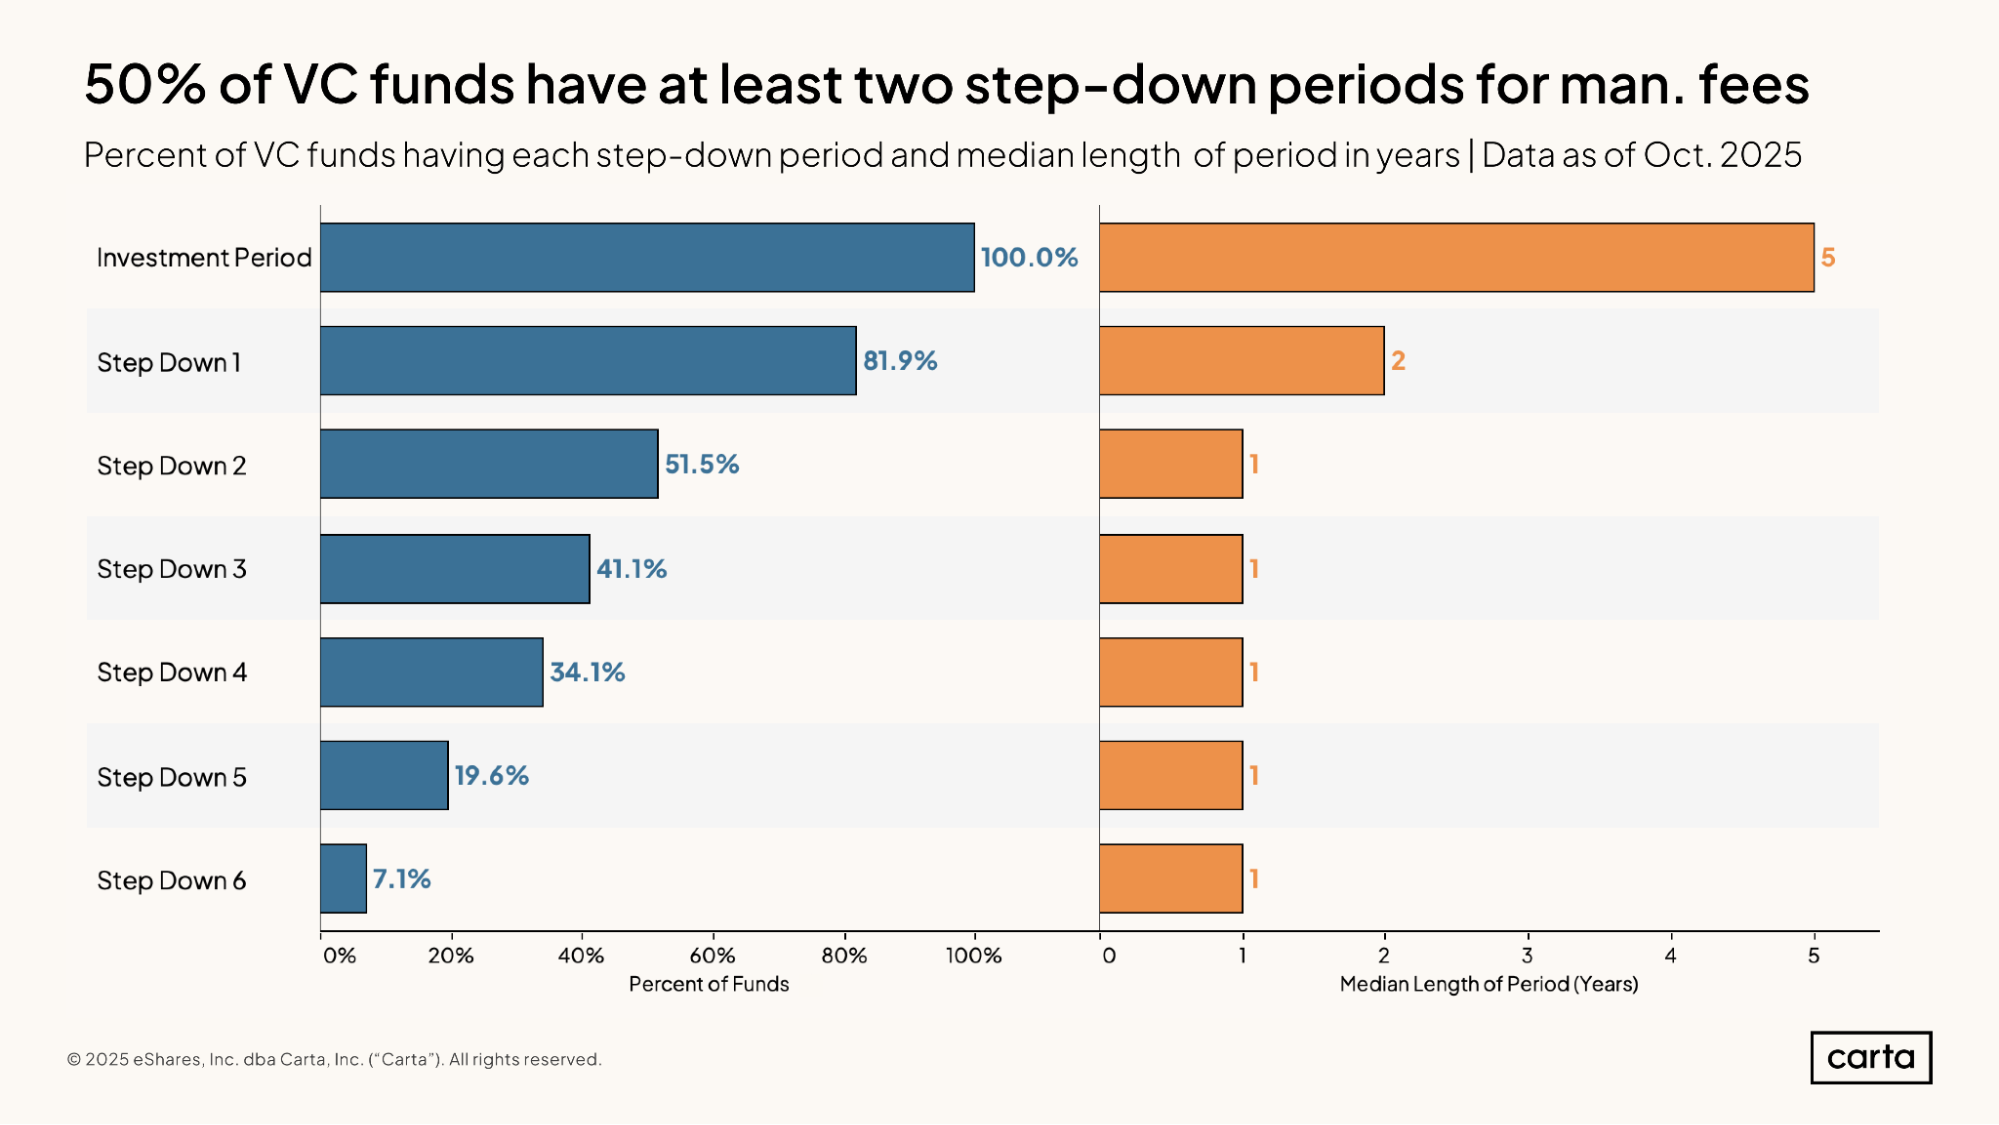
Some 81.9% of venture funds on Carta implement at least one step-down in management fees after the end of the investment period. A little more than half of VC funds have at least two step-downs, at 51.5%, and a little more than a third of funds have at least four step-downs, at 34.1%.
The length of the investment period plus all step-downs equals the fund term, which is often 10 years. Thus, for funds with multiple step-down periods, the number of step-downs is inversely related to their length. If a fund only has one step-down, it may be applicable for five years, just like the investment period rate.
In most cases, though, step-down periods are more abbreviated. Among funds that implement at least one step-down, the median period of the first step-down is two years. For all future step-downs beyond the first, the median length of the fee period is just one year.
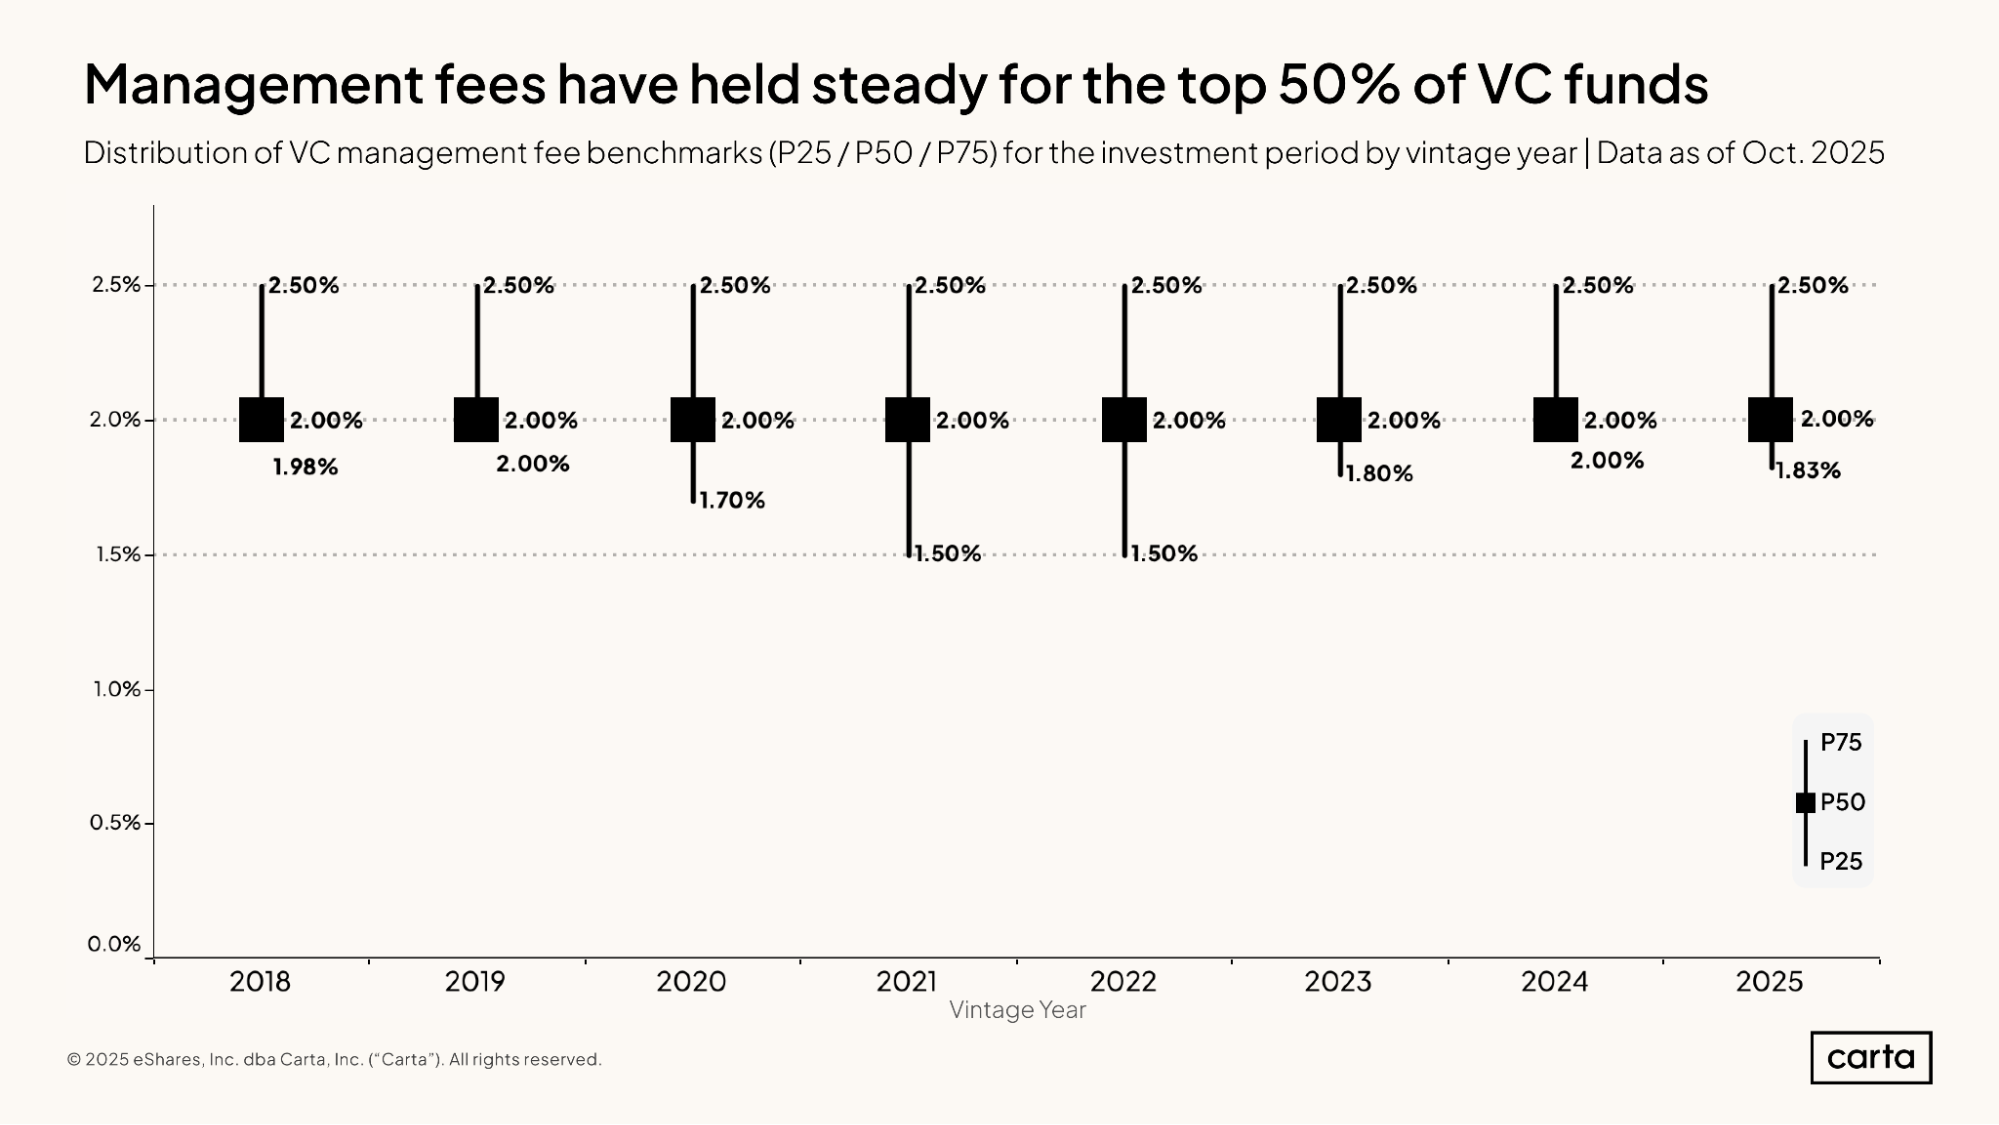
Over the past eight years, the typical management fees charged by venture funds on Carta have mostly held steady. For every vintage from 2018 through 2025, the median management fee is 2%, and the 75th percentile lands at 2.5%.
There’s a bit more variation at the 25th percentile of management fees, which dropped to 1.5% in both 2021 and 2022. This is likely due at least in part to the fact that those were the two busiest years for raising new venture funds in recent memory, as investors raced to raise new capital amid a generational bull run. Facing pitched competition for funding, some fund managers were willing to cut their fee rate in a bid to attract more LP dollars.
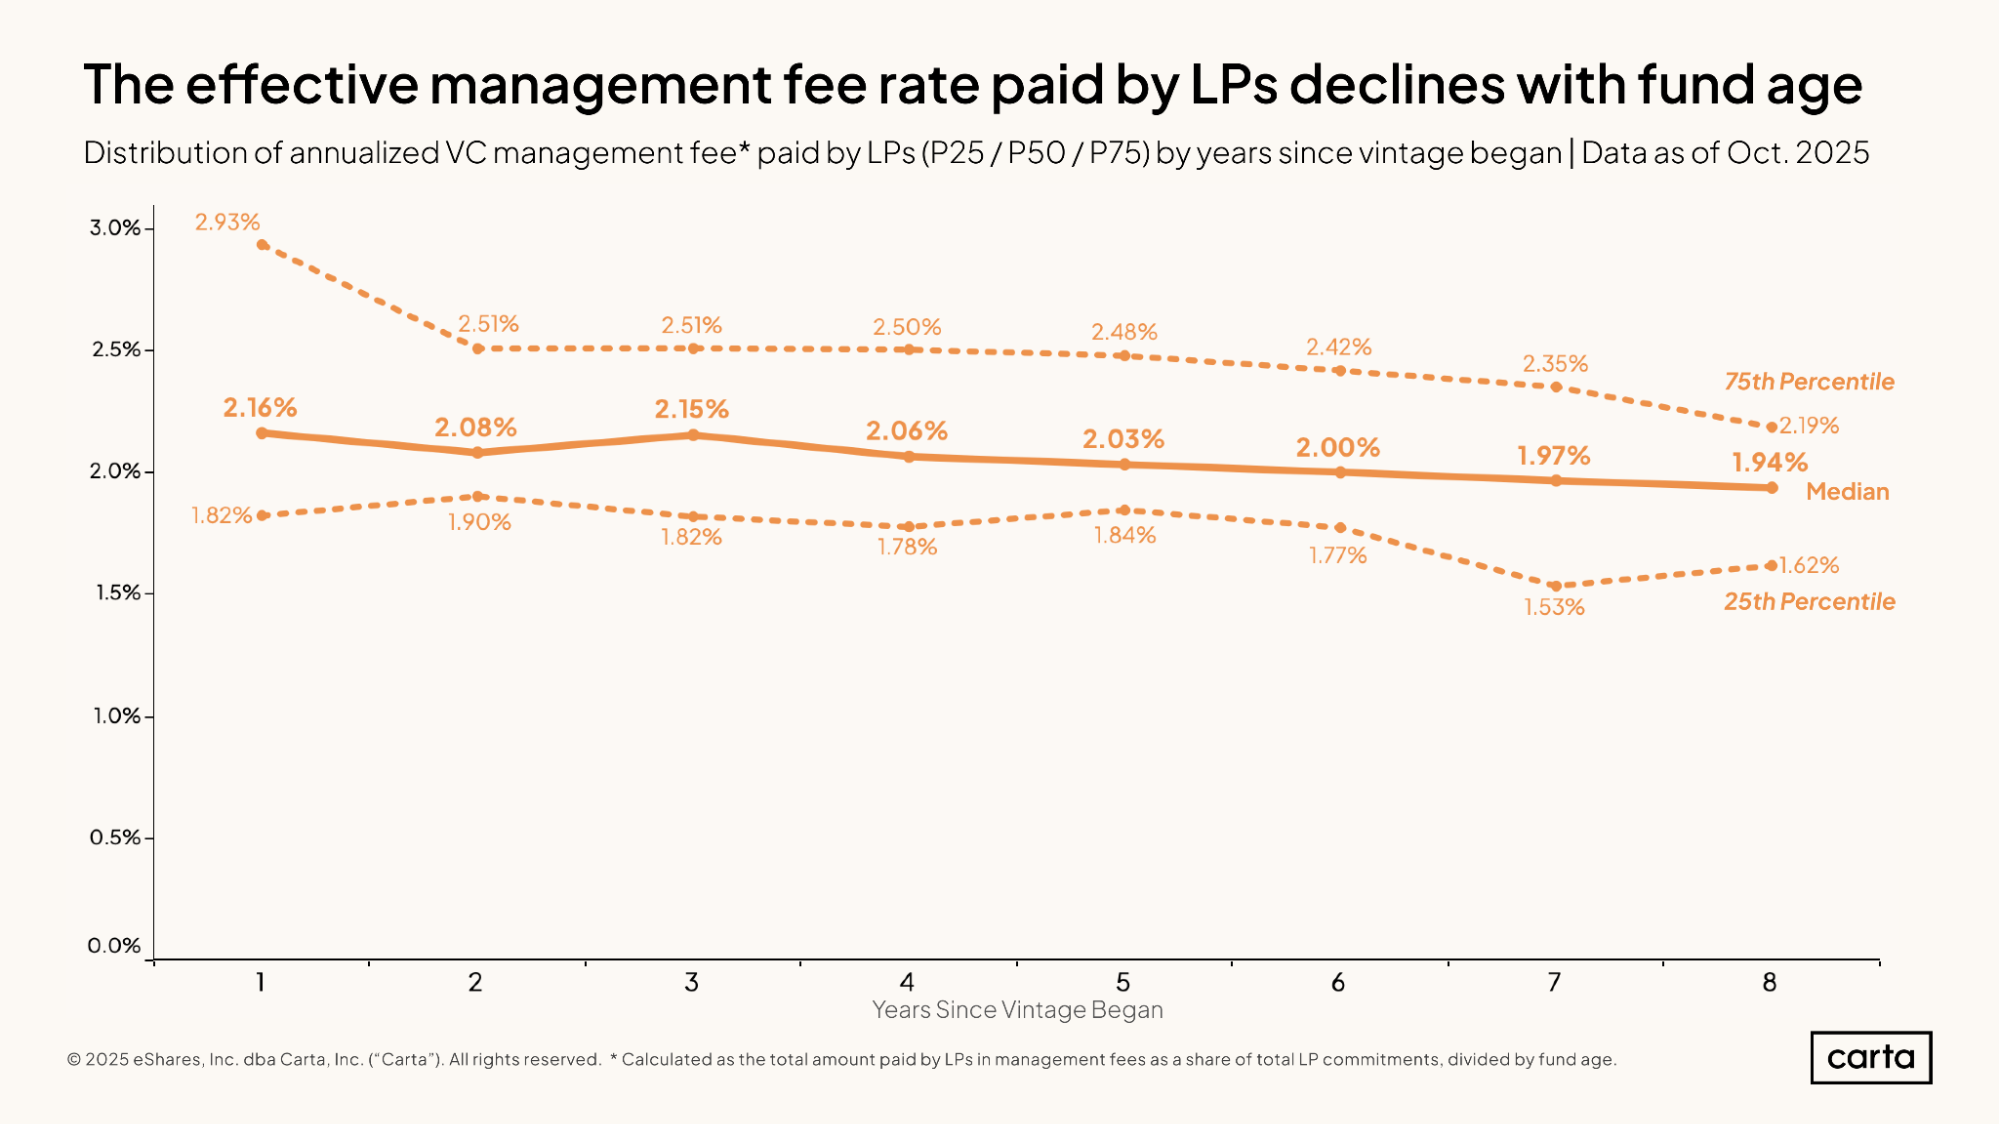
Most venture funds have at least one step-down in management fees during the overall term of the fund. This means that the effective management fee paid by LPs tends to decline over time. As a fund manager’s responsibilities shift away from making new investments and toward managing an existing portfolio, they typically receive less in fees.
The annualized management fee paid by LPs is calculated by determining the total amount of dollars they paid in management fees as a share of their total commitment to the fund, and then dividing that percentage by the fund’s age in years. At the one-year point after a fund begins, the median annualized management fee among VC funds on Carta is 2.16%. Since some funds have LPs pre-pay portions of their management fees, the initial blended median sits above 2%. By the eight-year point, the median falls to 1.94%, the 25th percentile to 1.62%, and the 75th percentile to 2.19%.
Carry and waterfall
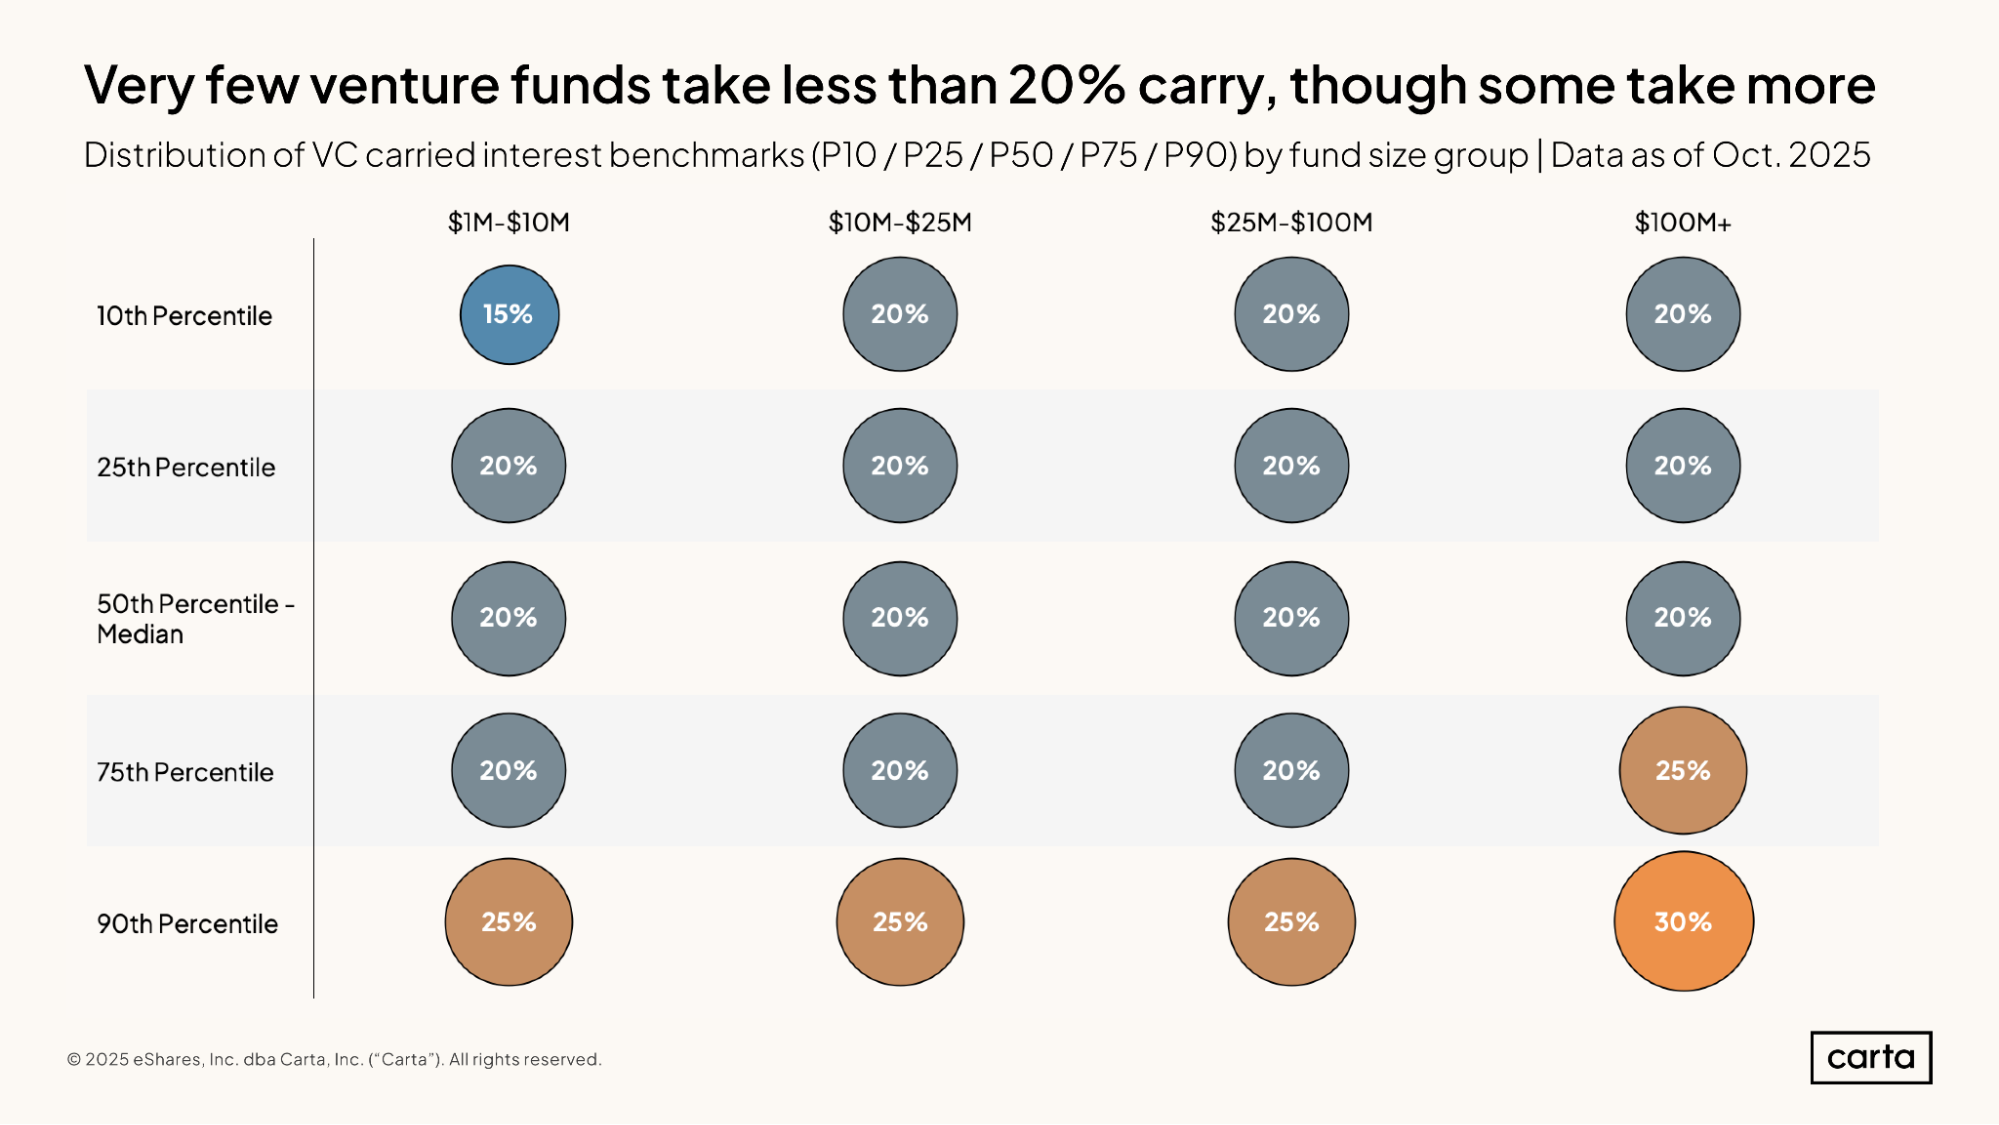
The standard venture fund has historically used a 2-and-20 fee structure, with 2% of total fund size going to management fees and the GP taking 20% of all profits—also known as carried interest, or carry—as a performance fee. That 20% figure for carried interest remains the norm across VC funds of all sizes that have been raised over the past several years. Likewise, a 2% management fee also remains the industry standard, as we saw in the two preceding charts.
For funds between $10 million and $25 million and those between $25 million and $100 million, there is very little disparity in the typical carry of 20% across the full spectrum of funds. Both the smallest and the largest VC funds see a little more variation: For funds between $1 million and $10 million, the 10th percentile for carried interest dips down to 15%. For funds with more than $100 million in commitments, the 75th percentile rises to 25% and the 90th percentile climbs to 30%.
The largest VC funds tend to be managed by more established and experienced VC firms. These GPs are more likely than their peers to be able to claim a slightly larger percentage of a fund’s overall profit.
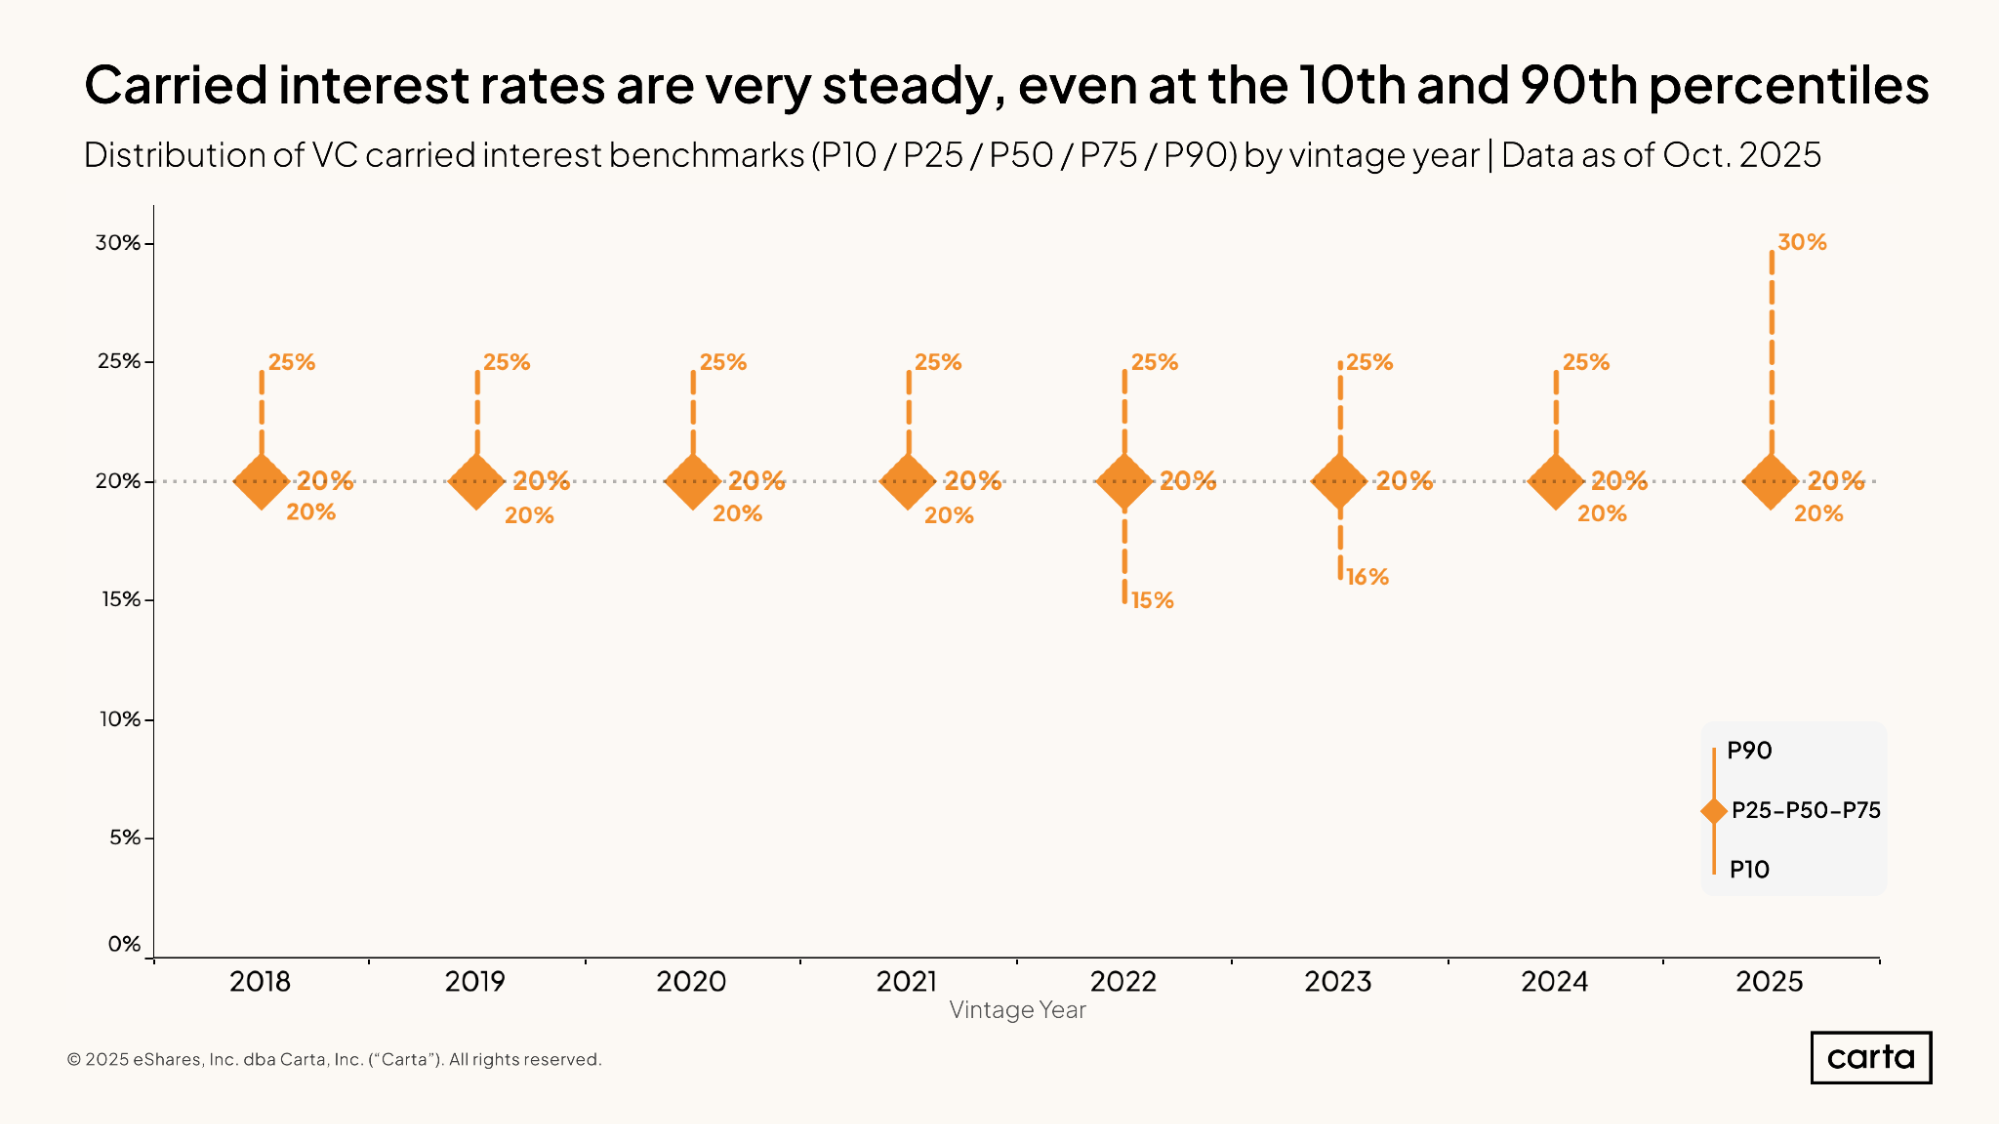
Across every vintage from 2018 through 2025, the middle 50% of all new venture funds pay exactly 20% of carried interest to their VCs. In most of these recent vintages, the 10th percentile for the GP’s share of carried interest is also 20%, and the 90th percentile is 25%. But there have been some recent shifts in the market at these more extreme ends of the spectrum.
The 10th percentile for GP carried interest dipped to 15% in 2022 and to 16% in 2023. Many of the funds in these vintages were raised in the midst of a significant slowdown in the broader VC market; it’s likely that a few GPs opted to reduce their share of carry as a way to induce more LP investment during a chilly period for fundraising. Conversely, in 2025, the 90th percentile for GP carry rose to 30%. Some top-tier funds—such as those with access to rounds raised by the buzziest AI startups—may have used their leverage with LPs to negotiate for a larger share of carried interest.
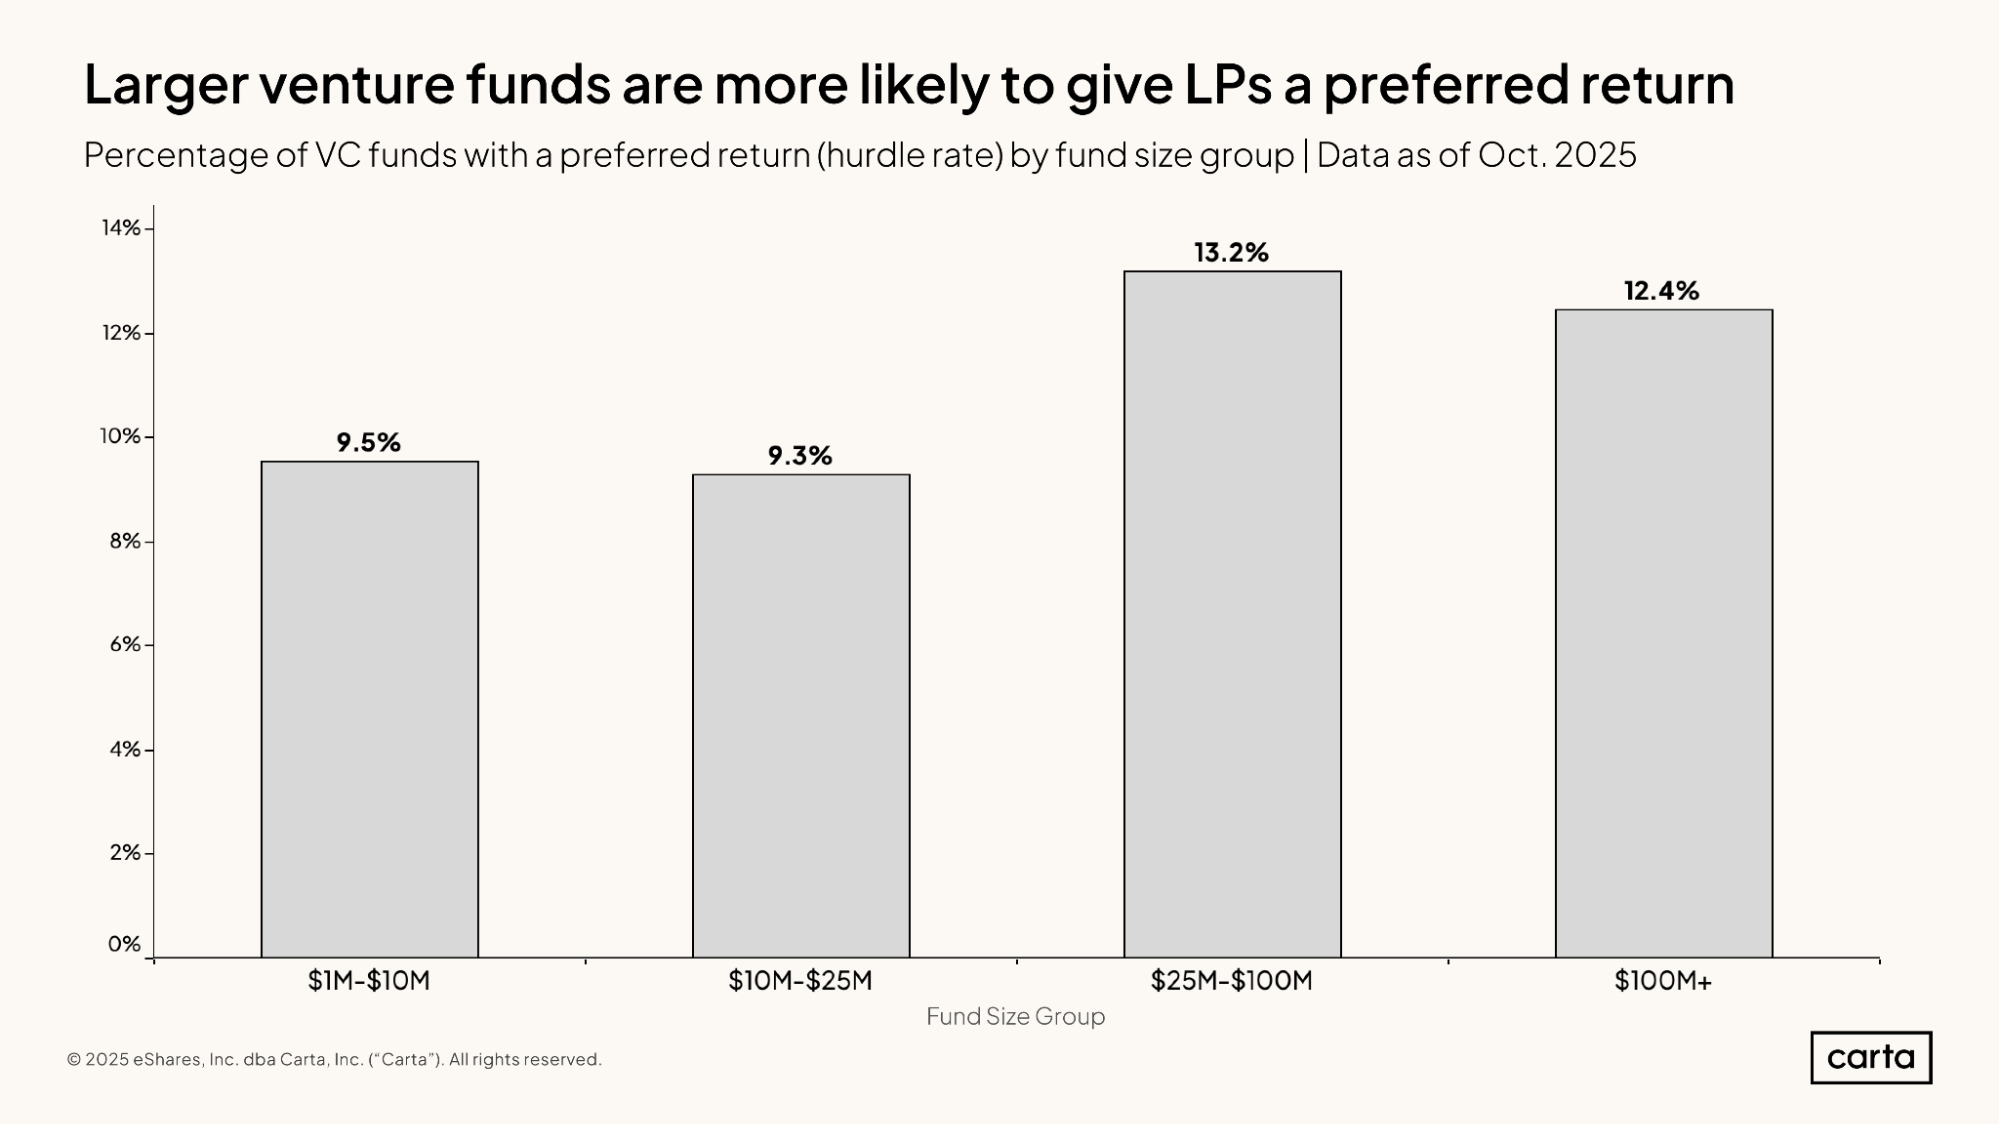
A preferred return, also known as a hurdle rate, delineates a certain threshold of returns that a fund must produce before the GP begins to share in the profits. If a fund has a 10% hurdle rate, for instance, then the fund must provide its LPs with a 10% return on their initial investment before any portion of the carry is distributed to the GP.
Larger venture funds are slightly more likely than smaller funds to give LPs a preferred return. But across all fund sizes, preferred returns remain rare. Some 9.5% of VC funds between $1 million and $10 million in size have a hurdle rate, compared to 12.4% of funds larger than $100 million.
Operating expenses
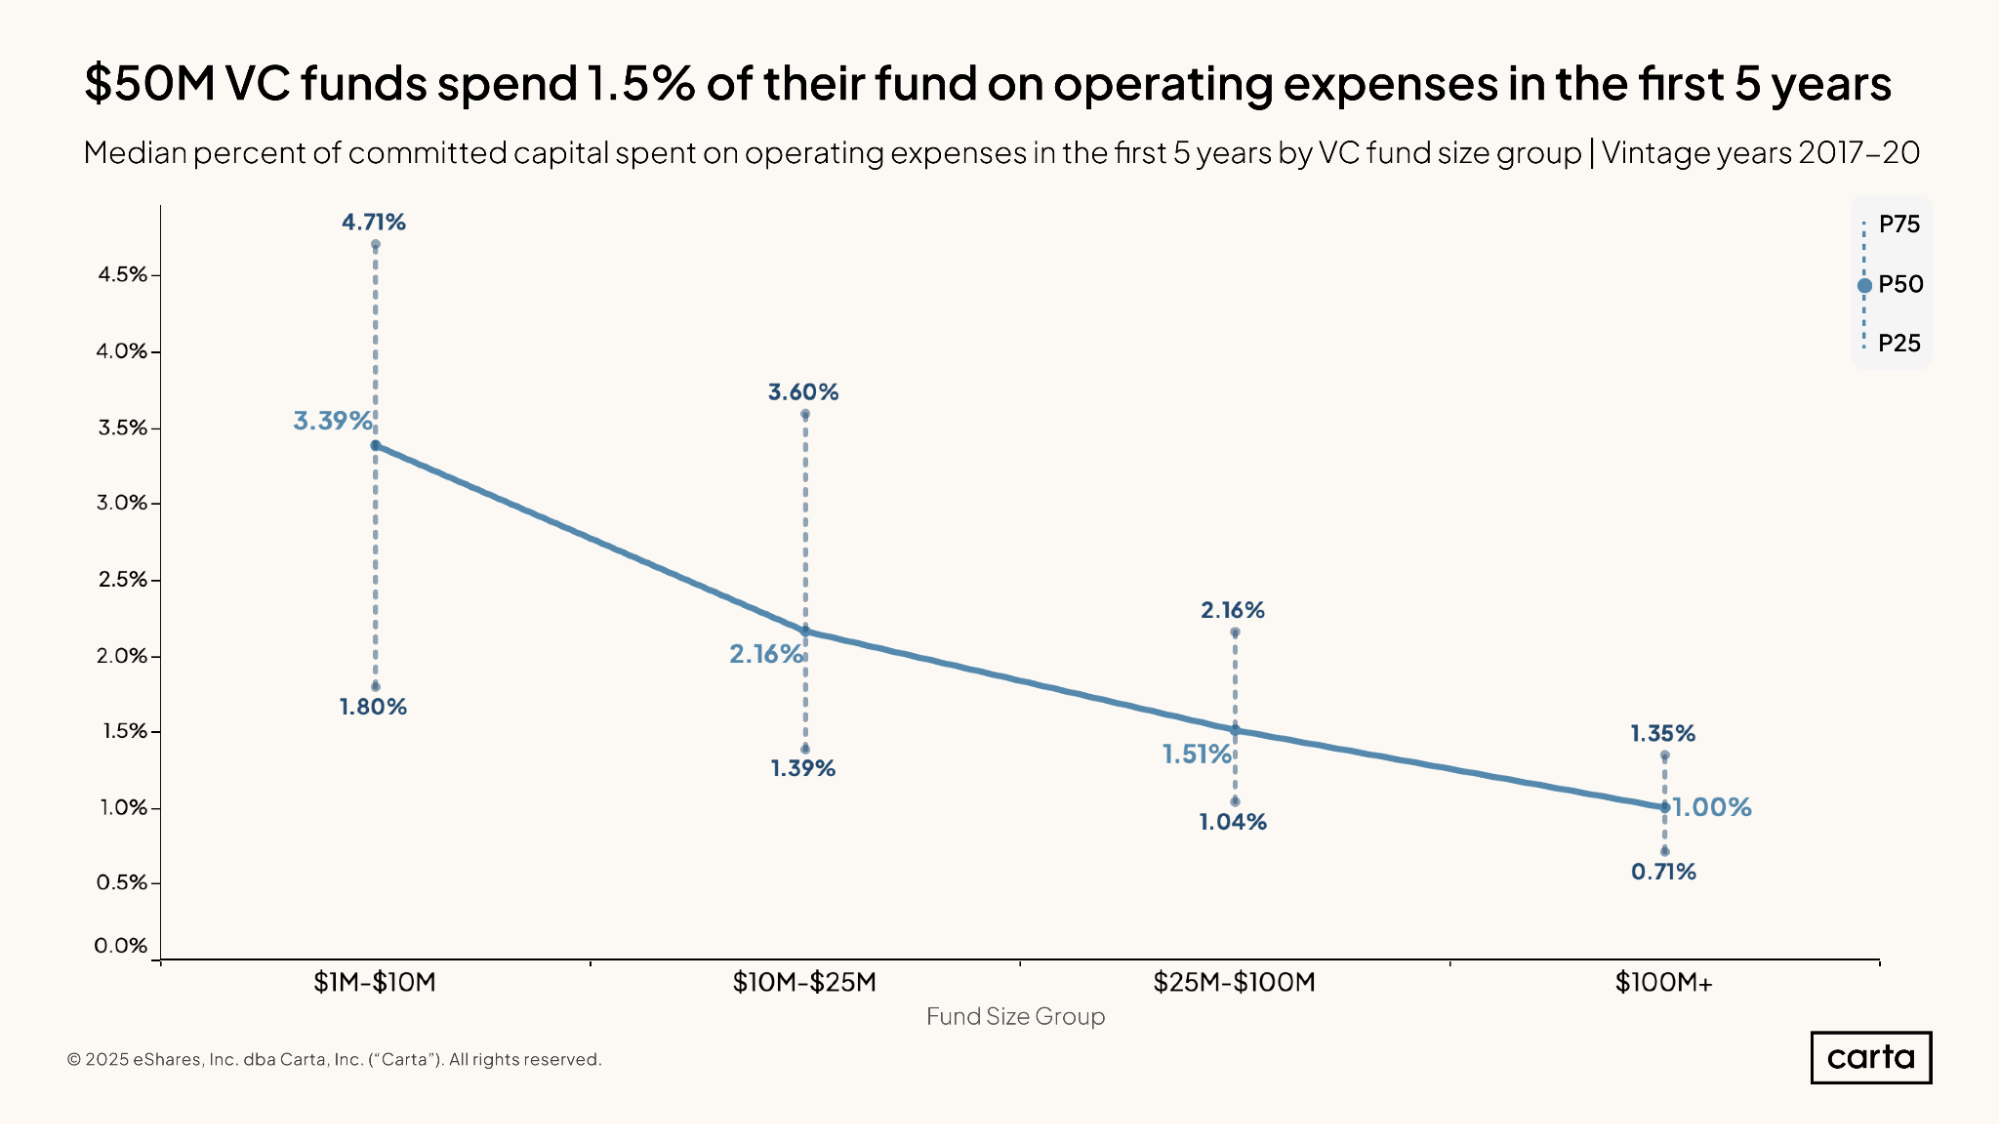
The median venture fund between $1 million and $10 million in size spends about 3.4% of its total committed capital on operating expenses during the first five years of the fund’s operations, the typical length of a fund’s investment period. Larger funds, meanwhile, tend to direct a smaller percentage of their total capital toward expenses: For the median fund over $100 million, expenses account for just 1% of capital.
Of course, 1% of $100 million is a much larger sum than 3.4% of $10 million. On an absolute basis, larger funds typically have more operating expenses than smaller ones. But fund size and expenses do not scale proportionally, which allows larger funds to spend a slightly larger percentage of their capital on new investments.
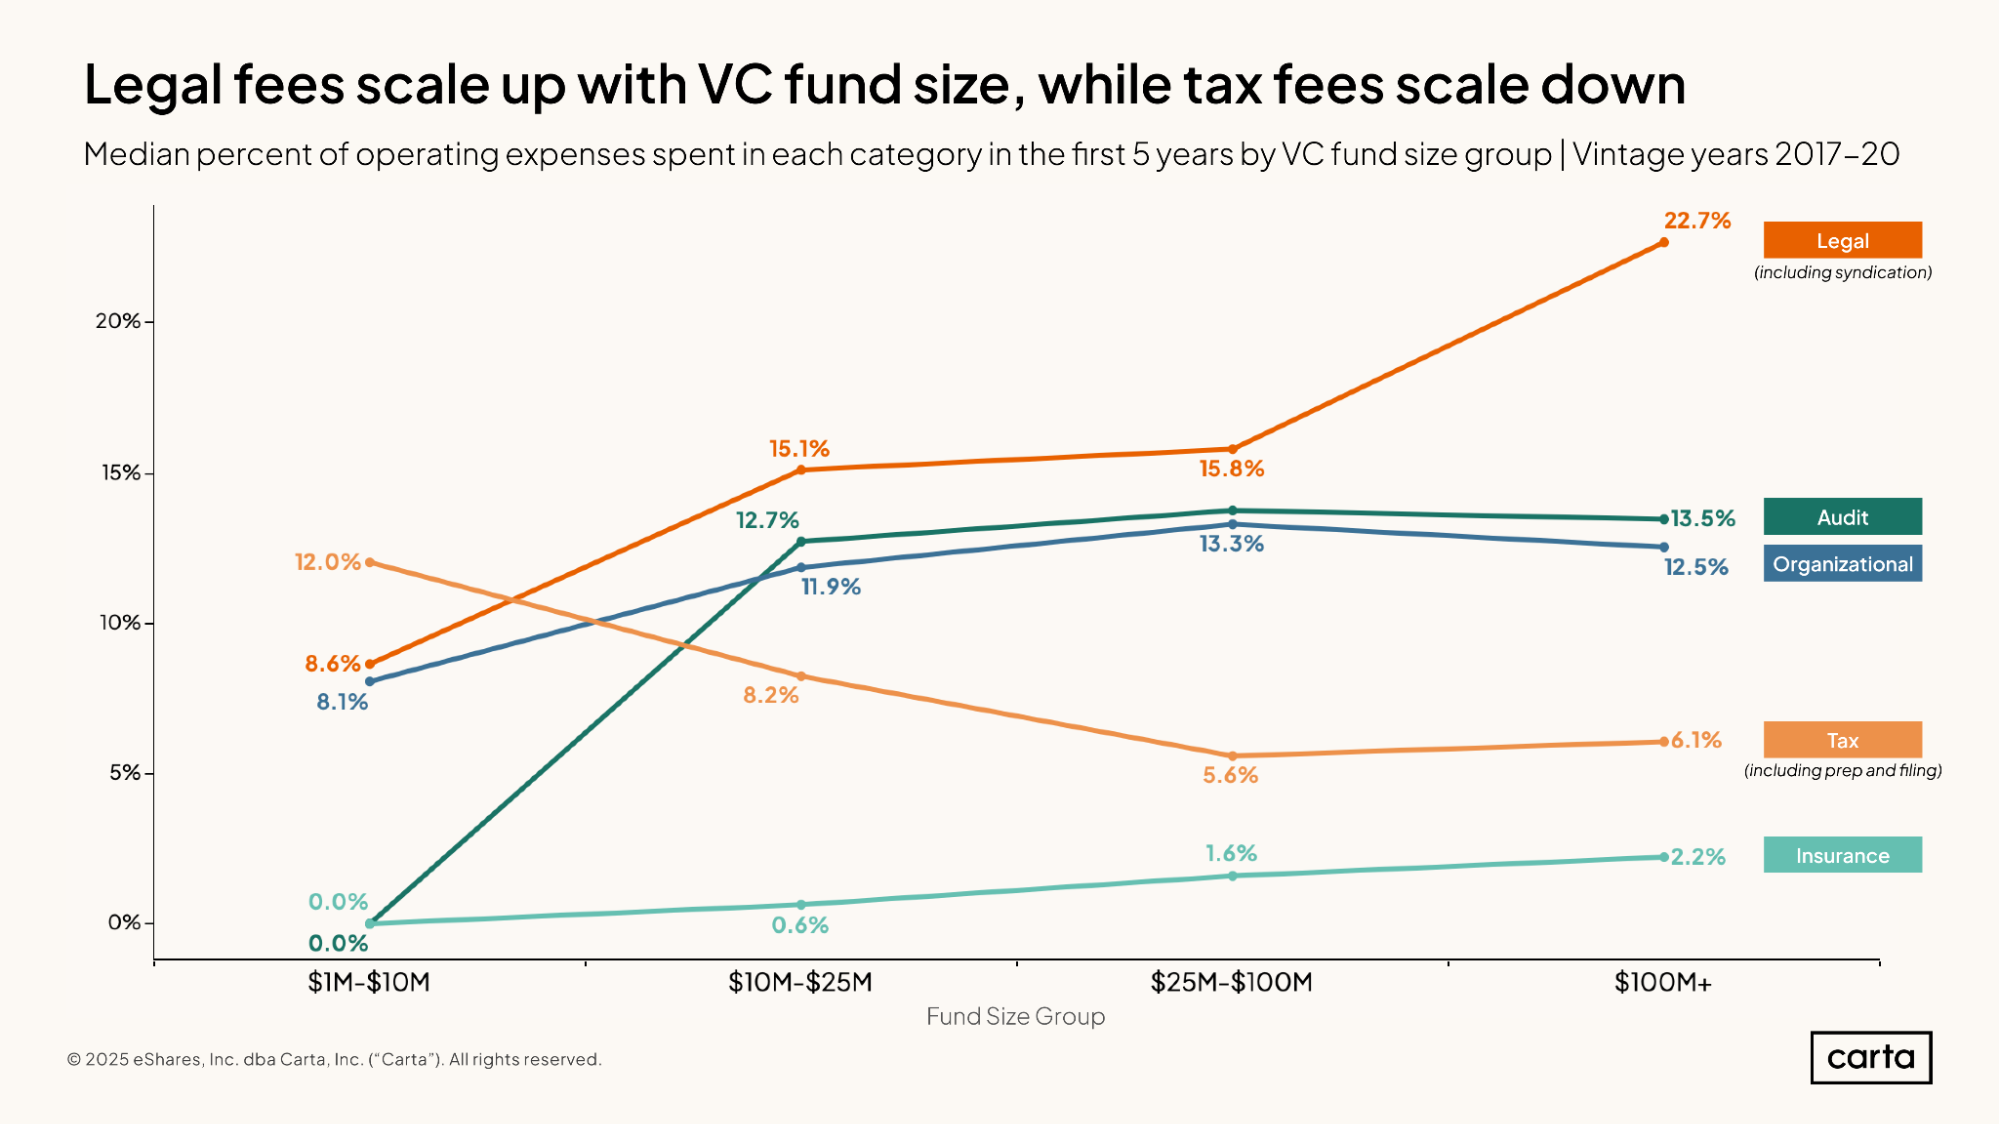
As fund size scales, VC fund managers tend to devote a larger percentage of their overall operating expenditure to legal fees and insurance fees, but a smaller percentage to tax-related fees. The smallest funds—those between $1 million and $10 million—tend not to spend any capital at all on audit expenses or organizational expenses. For larger funds, though, those two categories often make up more than 10% of overall opex.
VC fund managers have many other operating expenses in addition to those shown here, including payments for fund administration services, expenditures on software and other tech, and business-related subscriptions. These calculations of operating expenses also do not include costs that are paid by the management company rather than the individual fund, such as office space and investor salaries.
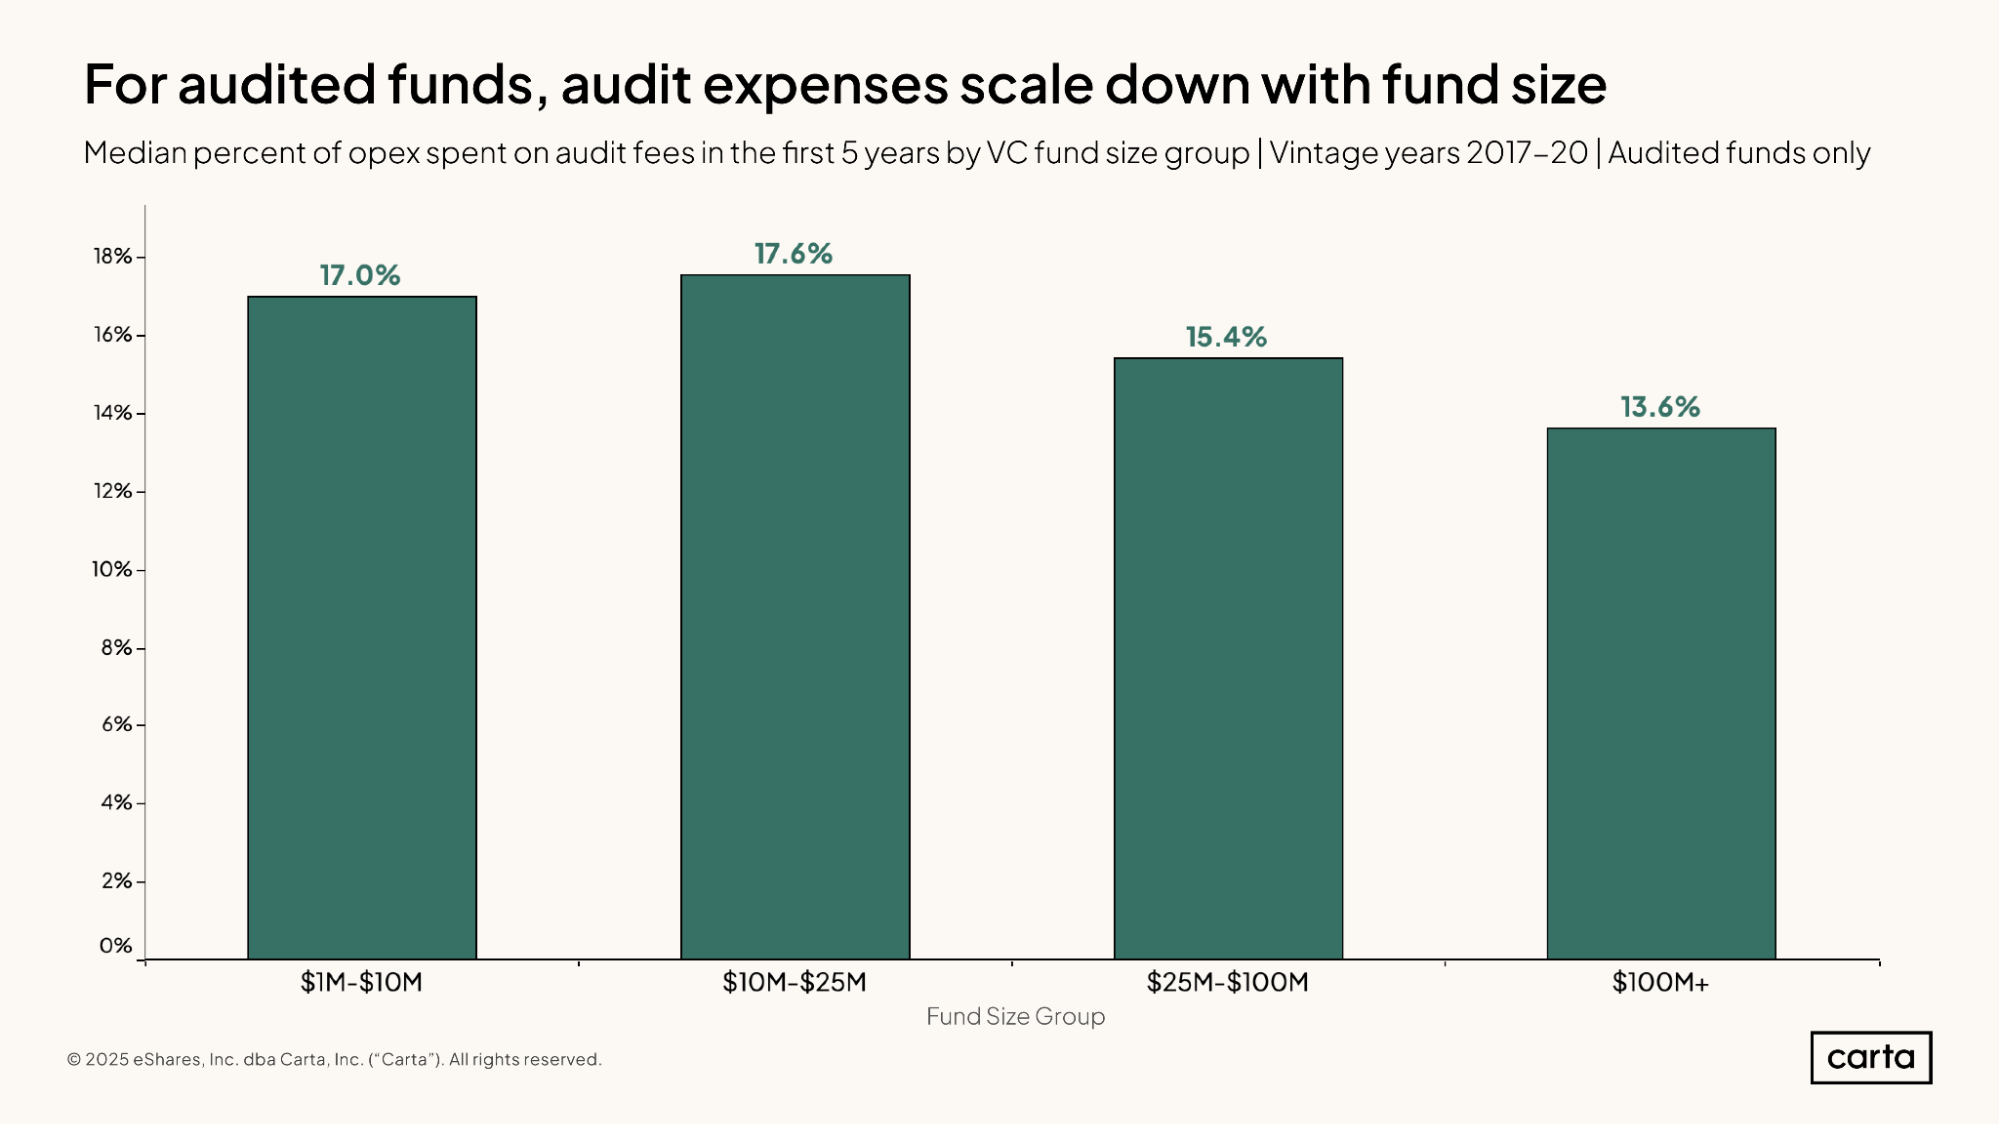
LPs typically require an annual audit of the venture funds they invest in. This comes with an important caveat, however: Investors in the smallest funds often waive the audit requirement. That is why the preceding chart showed that the median fund between $1 million and $10 million spends nothing on audit fees.
If we look only at funds that do get audited, how does that picture change? For funds spending any money in this category, the amount paid in audit fees tends to scale down with fund size. Among those $1 million to $10 million funds from the 2017 through 2020 vintages that did conduct audits, the median fund spent 17% of its operating expenses on audit fees in the first five years. For the largest funds—those with more than $100 million in commitments—the median manager devoted 13.6% of their operating expenses toward audit fees.
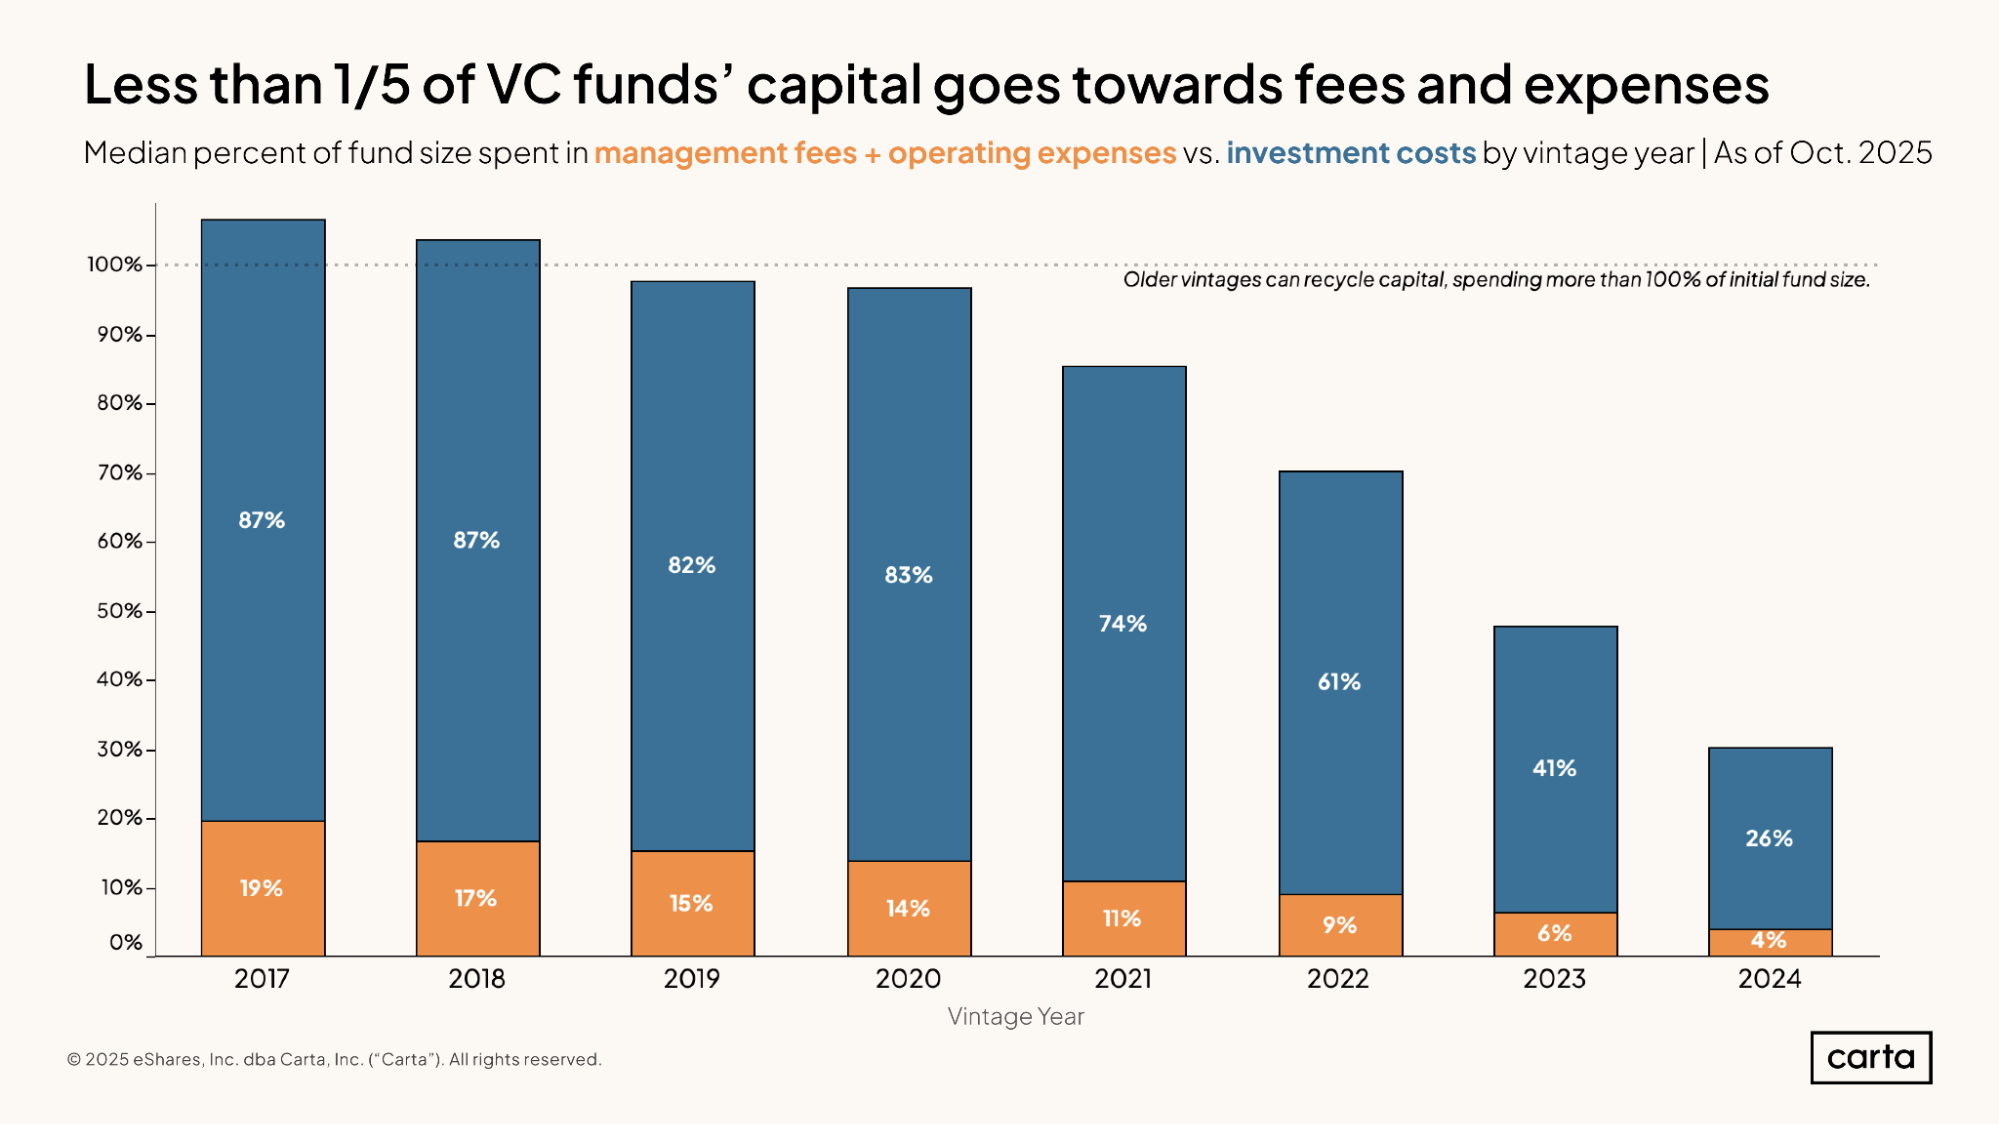
Regardless of fund maturity and vintage, the typical venture fund spends a much larger portion of its overall capital on investments than on management fees and operating expenses. But the exact dimensions of this spending divide evolve over time. As the years pass, funds’ expenditure on management fees and operating expenses grows faster than their expenditures on investments. This makes sense, as fees and expenses continue to apply even after funds have stopped making investments.
The median fund in the 2017 vintage, for instance, has spent 87% of its original committed capital on investment costs and another 19% of committed capital on fees and expenses (those numbers add up to a sum larger than 100% because some funds have recycled capital into new investments, allowing them to spend more than the originally committed sum). As a multiple, the median fund that’s eight years old has spent about 4.6x more on investments than on fees and expenses.
The median fund from 2020, meanwhile, has spent 83% of its committed capital on investments and another 14% on fees and expenses. That equates to 5.9x more spending on investments than on fees and expenses after five years of management. Among the 2024 vintage, the median fund has spent 26% of committed capital on investments and 4% on fees and expenses, for a multiple of 6.5x. This multiple will likely decrease as the 2024 vintage matures, similar to other recent vintages.
Methodology
Carta helps over 2,500 private equity and venture capital firms administer more than $150 billion in capital. We're setting a new standard in fund administration by sharing insights from our unmatched dataset about the private markets and venture ecosystem to help investors and limited partners make informed decisions and understand market conditions.
Overview
This study uses an aggregated and anonymized sample of Carta fund customer data through October 2025. It includes about 2,000 private equity and venture capital funds that are domiciled in the U.S. Datasets for this report were prepared by Janet Deng, Ray Raff, and Paul Torres from Carta's Data Science team.
Funds that have contractually requested that we not use their data in anonymized and aggregated studies are not included in this analysis. Historical data may change in future studies because there is typically an administrative lag between the time an event took place and when it is recorded in Carta. In addition, new funds signing up for Carta’s services will increase historical data available for the report.
Basic definitions
We define “vintage year” as the year in which the first cost basis (either conversion or new investment) for a fund occurred. “Fund size” is defined as the sum of all capital commitments made by limited partners and general partners together at the close of a fund.
Capital calls
A capital call is the formal request made by fund managers to limited partners to transfer a portion of their committed capital to the fund. When an LP fulfills the capital call, that portion is then counted as contributed or paid-in capital. The notice period of a capital call is the time between when LPs are sent the formal request and the due date of the request.
Active investments
An active investment is one for which the fund still has an active cost basis. If the fund has partially exited an investment, it would still be considered an active investment.
Expense categories
Private funds keep track of all their financial transactions on their general ledger. Each transaction is categorized for legal and accounting purposes. The operational expense categories presented in this report are taken from general ledger account codes.