
- How to measure investment fund performance: VC & PE metrics explained
- What is fund performance?
- Why is performance measurement crucial for VC and PE funds?
- Key metrics for investment fund performance
- Internal rate of return (IRR)
- Multiple on invested capital (MOIC)
- Total value to paid-in (TVPI)
- Distributions to paid-in (DPI)
- Residual value to paid-in (RVPI)
- Net asset value (NAV)
- Environmental, Social, and Governance (ESG) metrics
- Comparing performance across fund stages
- The J-curve effect
- How to track investment performance over the fund lifecycle
- Challenges in measuring fund performance
- Best practices for fund performance reporting
Understanding how to measure fund performance is essential for assessing a fund’s ability to generate returns. By mastering key financial metrics, fund managers and CFOs can make more informed decisions, optimize their investment strategies, and build trust with limited partners (LPs).
This guide will walk you through the core metrics, best practices, and new trends shaping how venture capital (VC) and private equity (PE) funds are evaluated today.
What is fund performance?
Fund performance refers to how effectively a private fund grows and returns capital to its investors over time. VC and PE firms use a variety of different metrics (such as IRR, MOIC, TVPI, and DPI) to measure fund performance as comprehensively as possible. This information is usually summarized in a document called a tear sheet, which fund managers send to their LPs on a quarterly or monthly basis.
Why is performance measurement crucial for VC and PE funds?
In the private markets, performance measurement is vital for capital allocation, investment strategy, and building LP confidence. Accurate performance data helps fund managers identify strengths, address weaknesses, and benchmark against other funds to assess how their investments are performing relative to the market. It can also inform strategic decisions on reinvestment, follow-on funding, and portfolio rebalancing.

Key metrics for investment fund performance
Internal rate of return (IRR)
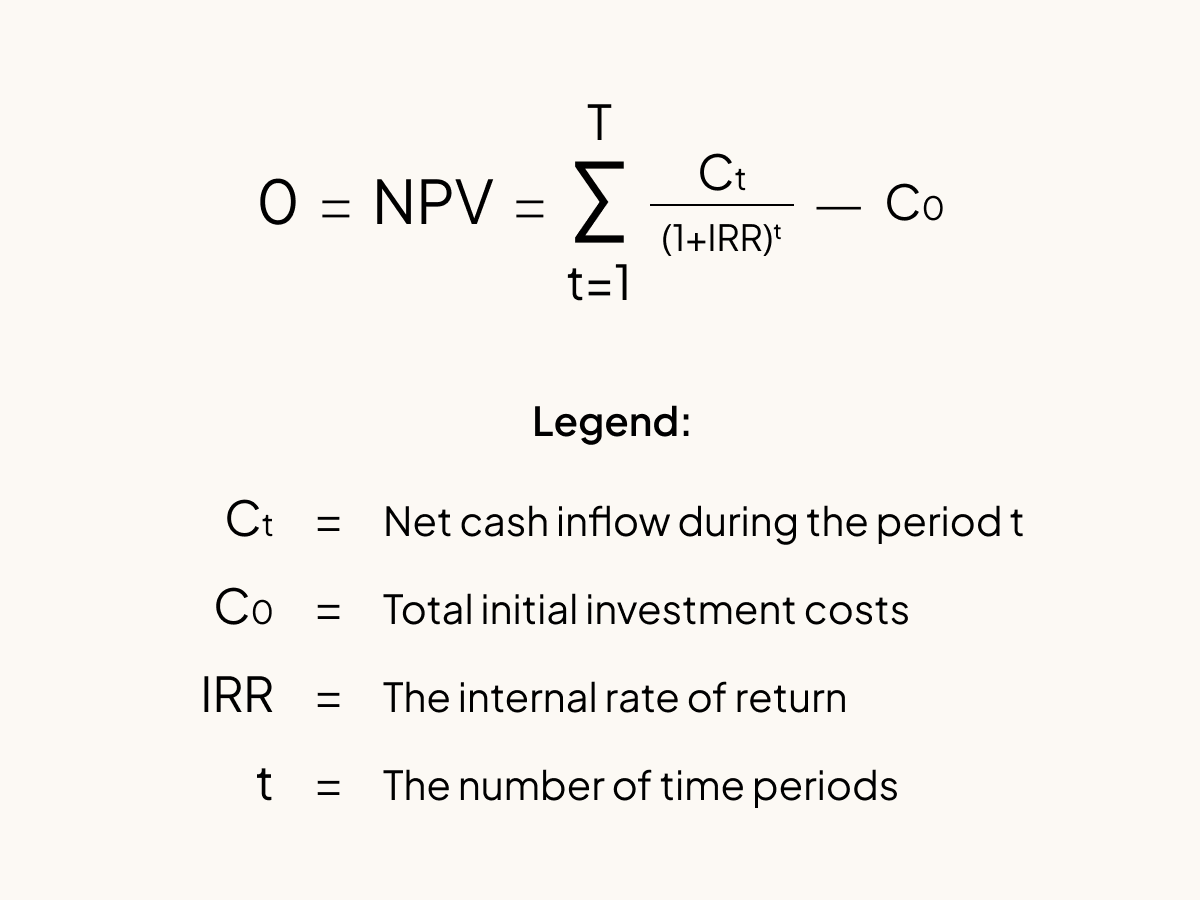
IRR is a way of measuring the expected rate of return on an investment over time. In more technical terms, it is the annualized effective compounded return rate that makes the net present value (NPV) of all cash flows (both inflows and outflows) from a fund equal to zero.
Strengths: IRR accounts for the timing and magnitude of cash flows, making it a dynamic measure of fund performance.
Limitations: IRR can be distorted by early company exits or delayed cash flows, and may not always reflect the true economic value—especially in young funds.
A higher IRR generally indicates better fund performance, but it should be interpreted alongside other metrics and in the context of the fund’s lifecycle and strategy. In venture capital, LPs typically expect a fund’s net IRR to reach at least 20% by the time it has exited all of its investments. Other asset classes (such as public equities, private equity, and real estate) have differing IRR expectations.
Using a spreadsheet-based IRR calculator or fund administration software like Carta are efficient ways to determine IRR metrics for your fund or portfolio companies.
→ Download Carta's free IRR calculator
Multiple on invested capital (MOIC)
MOIC is the ratio of the total value (realized and unrealized) returned to investors divided by the total capital invested. It provides a straightforward view of how much value a fund has created per dollar invested.
Generally, MOIC is used across private asset classes as a gross metric, excluding fund management fees and carried interest. Some funds may report net MOIC, which includes fees and carry in the final calculation.
MOIC vs. IRR:
MOIC is best for understanding absolute value creation, regardless of time.
IRR is more useful for comparing investments with different time horizons or cash flow patterns.

Total value to paid-in (TVPI)
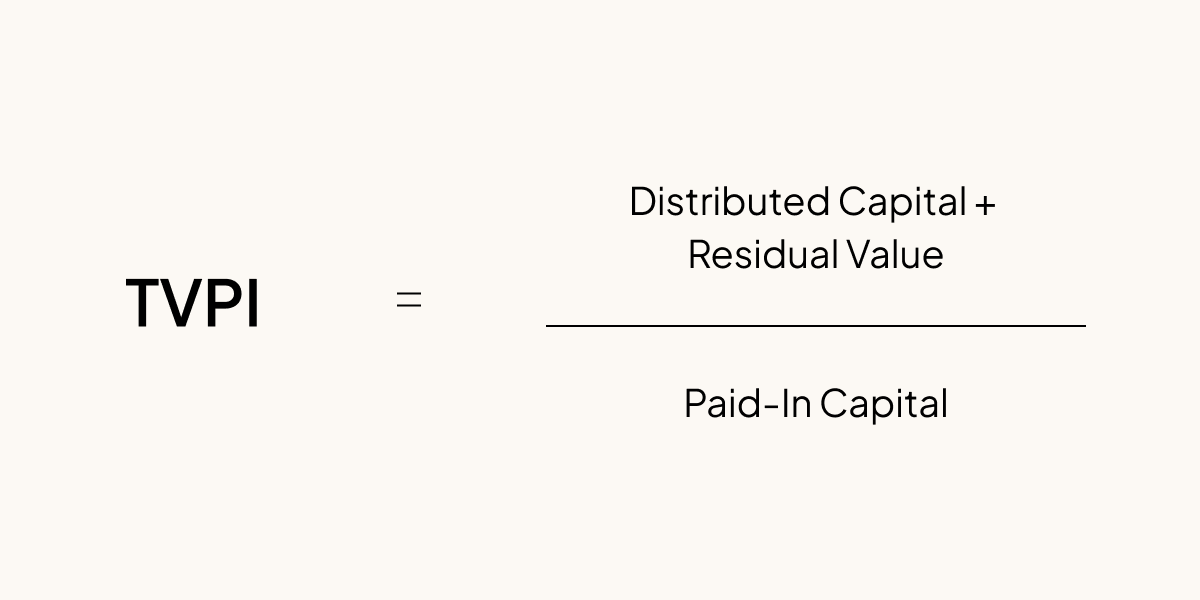
TVPI combines both realized returns (i.e. distributions) and unrealized value (a fund’s remaining portfolio) relative to the capital paid in by LPs. It’s a holistic measure of a fund’s total performance at any point in its lifecycle.
TVPI allows fund managers and LPs to assess the overall effectiveness of the fund’s investment strategy, including exits and current holdings.
Distributions to paid-in (DPI)
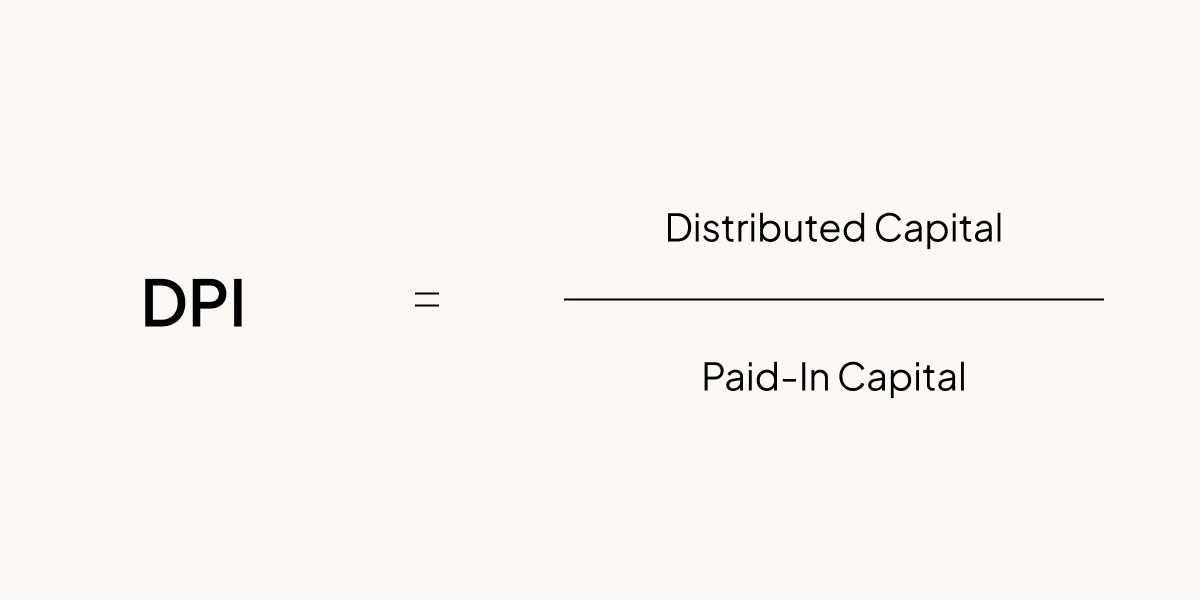
DPI measures the amount of capital returned to LPs as a proportion of their invested capital. It’s a key indicator of liquidity and the fund’s ability to generate cash returns.
Unlike IRR, DPI doesn’t change based on how long it takes to realize an investment, and it doesn’t take into account the book value (i.e. how much the fund would be worth if sold) of unrealized investments in a fund.
Residual value to paid-in (RVPI)
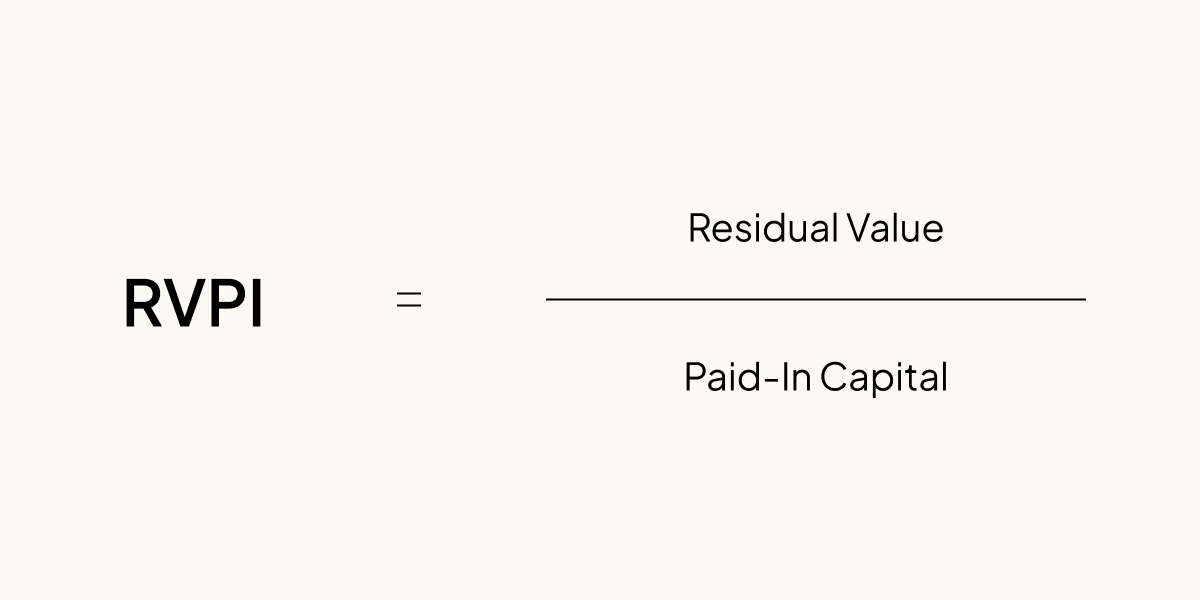
RVPI is the ratio of the current value of remaining portfolio investments to the total capital paid in by LPs. It reflects the unrealized portion of a fund’s value, showing how much of the original investment is still held in active investments.
RVPI is used to help investors estimate a fund’s remaining earning potential, but it’s important to note that it’s not guaranteed. In the early and middle stages of a fund’s lifecycle, RVPI tends to be higher. As the fund matures and exits occur, RVPI typically decreases, while DPI increases.
Together with DPI, RVPI provides a complete picture of both realized and unrealized value, as TVPI = DPI + RVPI.
Net asset value (NAV)
NAV represents the current market value of a fund’s holdings, minus any outstanding liabilities. It provides a snapshot of the fund’s value at a specific point in time, which is useful for interim reporting and portfolio monitoring.
Calculating NAV helps ensure transparency for LPs, especially when distributions have not yet occurred. However, there is no simple formula to assess the net value of an asset, meaning that funds use different approaches and arrive at different results. Moreover, NAV can fluctuate based on market conditions and changes in portfolio company valuations. For instance:
In a bull market, there are typically more private company exits, higher valuations, and stronger portfolio performance metrics.
In a bear market, company valuations are lower and exit activity slows down.
If a portfolio company has not received a market-based valuation in a recent funding round, investors may use a range of different methodologies and variables to estimate the company's current value—such as financial performance or comparable company analysis (“comps”).
Environmental, Social, and Governance (ESG) metrics
ESG metrics—such as carbon footprint, diversity, and governance practices—are increasingly used to assess the broader impact and sustainability of investments. LPs and regulators are demanding more transparency on ESG outcomes. Funds now track ESG-related KPIs alongside financial metrics, including them in annual reviews and impact reports.
Examples of ESG-driven outcomes:
Investments in companies with strong ESG profiles may command higher exit multiples.
Funds with robust ESG integration often attract a broader base of LPs and enjoy reputational benefits.
Comparing performance across fund stages
The J-curve effect
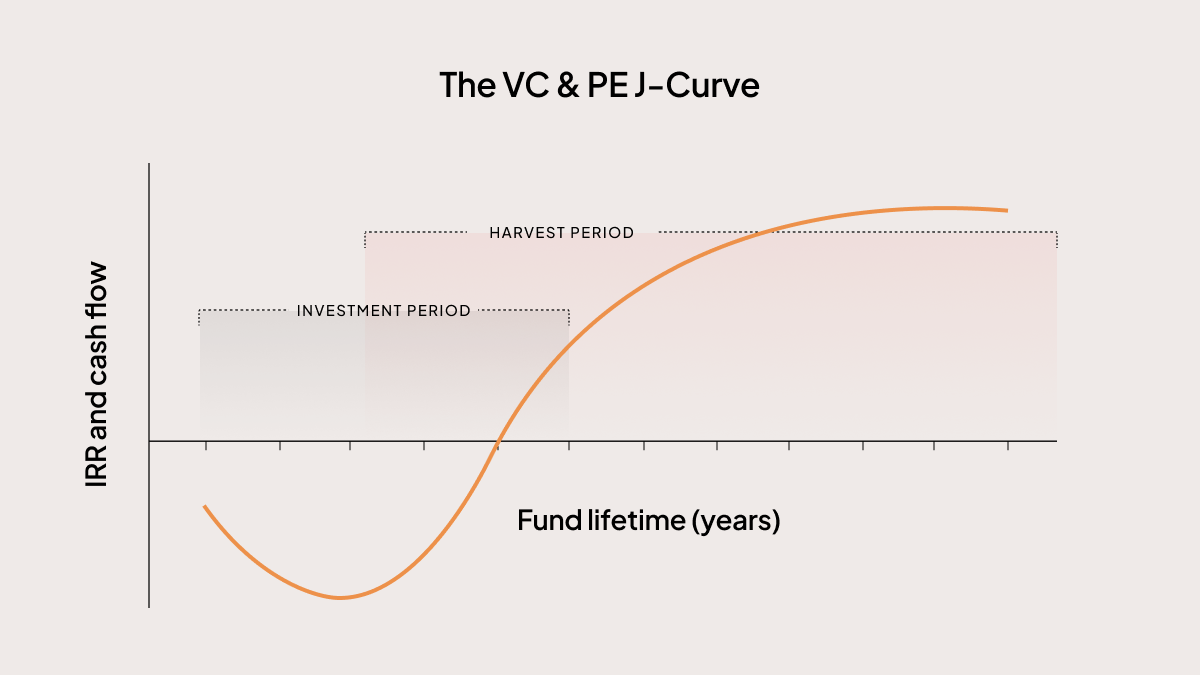
The J-curve describes the typical trajectory of fund returns: Negative or low returns in the early years followed by accelerated gains as investments mature and exits occur.
The graph below illustrates a typical J-curve, with an initial dip during the “investment period,” followed by recovery and value creation during the “harvest period.”
There are several reasons why the J-curve occurs:
Upfront costs: At the outset, funds incur management fees, organizational expenses, and make initial investments that may not immediately generate returns.
Investment maturation: Early investments often take years to develop, with value creation and exits (such as IPOs or acquisitions) typically occurring later in the fund’s lifecycle.
Delayed realizations: Distributions to LPs are usually back-loaded, as portfolio companies need time to grow and reach liquidity events.
It’s crucial for fund managers and LPs to be aware of the J-curve effect, so they understand that early negative returns are not necessarily a sign of poor performance. Reporting regularly on portfolio progress and sharing J-curve projections with LPs can help funds set realistic expectations.
How to track investment performance over the fund lifecycle
Funds in the early stages of investing, emphasize capital deployment, initial valuations, and qualitative milestones. Towards the middle stages, monitor portfolio growth, follow-on investments, and interim valuations. As funds reach the late stages of investing, focus on analysing realized returns, distributions, and cash flow.
Challenges in measuring fund performance
Common challenges:
Illiquidity: Private investments are not easily tradable, complicating valuation and performance tracking.
Valuation uncertainty: Determining fair value for private assets can be subjective and varies by methodology.
Timing of cash flows: Irregular cash flows make it harder to compare performance across funds.
How fund managers can confront these challenges:
Adopt standardized valuation practices and use third-party audits for data integrity.
Communicate transparently with LPs about assumptions and methodologies.
Leverage modern fund management platforms to automate data collection, calculations, and reporting, reducing errors and increasing transparency
Use advanced analytics tools for real-time portfolio assessment, scenario modeling, and benchmarking, empowering funds to make data-driven decisions and provide LPs with up-to-date insights.
Best practices for fund performance reporting
What LPs expect in fund performance reports:
Consistent, timely, and transparent updates.
Clear explanations of key metrics and methodologies.
Disclosure of risks, assumptions, and market context.
How to build trust when reporting to LPs:
Use standardized templates and reporting frameworks.
Leverage technology for real-time and secure data sharing.
Foster open dialogue and respond proactively to LP questions.
DISCLOSURE: This communication is on behalf of eShares, Inc. dba Carta, Inc. ("Carta"). This communication is for informational purposes only, and contains general information only. Carta is not, by means of this communication, rendering accounting, business, financial, investment, legal, tax, or other professional advice or services. This publication is not a substitute for such professional advice or services nor should it be used as a basis for any decision or action that may affect your business or interests. Before making any decision or taking any action that may affect your business or interests, you should consult a qualified professional advisor. This communication is not intended as a recommendation, offer or solicitation for the purchase or sale of any security. Carta does not assume any liability for reliance on the information provided herein. ©2026 Carta. All rights reserved. Reproduction prohibited.