Executive summary
By nearly every measure, 2025 was a strong year for startup fundraising, capping a multi-year recovery from the market reset of 2022 with capital, valuations, and deal terms all trending in founders' favor. But the interest in AI is not just infusing much-needed capital into the private markets; it's fundamentally changing what normal looks like.
Startups on Carta combined to raise nearly $120 billion in new funding in 2025, up nearly 17% from 2024. And it ended on a particularly strong note. In Q4 alone, startups brought in $36.1 billion in new capital, the most lucrative quarter for fundraising since Q2 2022.
The hangover from the market reset that occurred in 2022 is over. Less than 14% of all new fundings in Q4 were down rounds, the lowest rate in the past three years. Startups have now either raised multiple rounds since the valuation climate began to shift, or they have achieved enough growth in the past three years to again justify a valuation increase, in many cases with the aid of new AI-powered tools and efficiencies.
The transformative effect of AI all across the startup landscape has resulted in an increasingly bifurcated market, with capital concentrating into fewer, bigger, and usually AI-dominated rounds. Total round count in 2025 fell to a six-year low. At Series D, 58% of all cash raised went to AI startups. And median valuations are up at every stage, including a staggering 667% year-over-year increase at Series E+.
One thing that’s remained the same over the past few years, however, is a challenging environment for IPOs and other forms of liquidity. As this trend continues, late-stage bridge funding is growing more common. And tender offers are on the rise. Startups on Carta combined to conduct 396 tenders during 2025—up 62% from 2024—with nearly 20% of these offerings coming from companies at Series E or later.
2025 highlights
Defining the AI premium: At every stage from Series A onward, AI startups raised larger rounds and garnered higher valuations than their non-AI counterparts in 2025. At Series A, the median AI valuation was 38% higher than the median non-AI valuation. At Series E+, the AI valuation premium reached 193%.
The Northeast strikes back: Startups based in the Northeast were responsible for 24.8% of all cash raised on Carta in the U.S. over the course of last year. During Q4, that proportion reached 33.1%, the region’s largest market share over the past three years. The West is still clearly the top region for U.S. fundraising, but the Northeast is gaining ground.
Dilution keeps dropping: Over the past year, median dilution on all rounds from seed through Series C has fallen from about 18% to 16%, continuing a years-long trend. Two years ago, median dilution across those stages stood at 19%. The biggest drop-off in 2025 came at Series B, where median dilution fell from about 15% to 12.9%.
Key trends
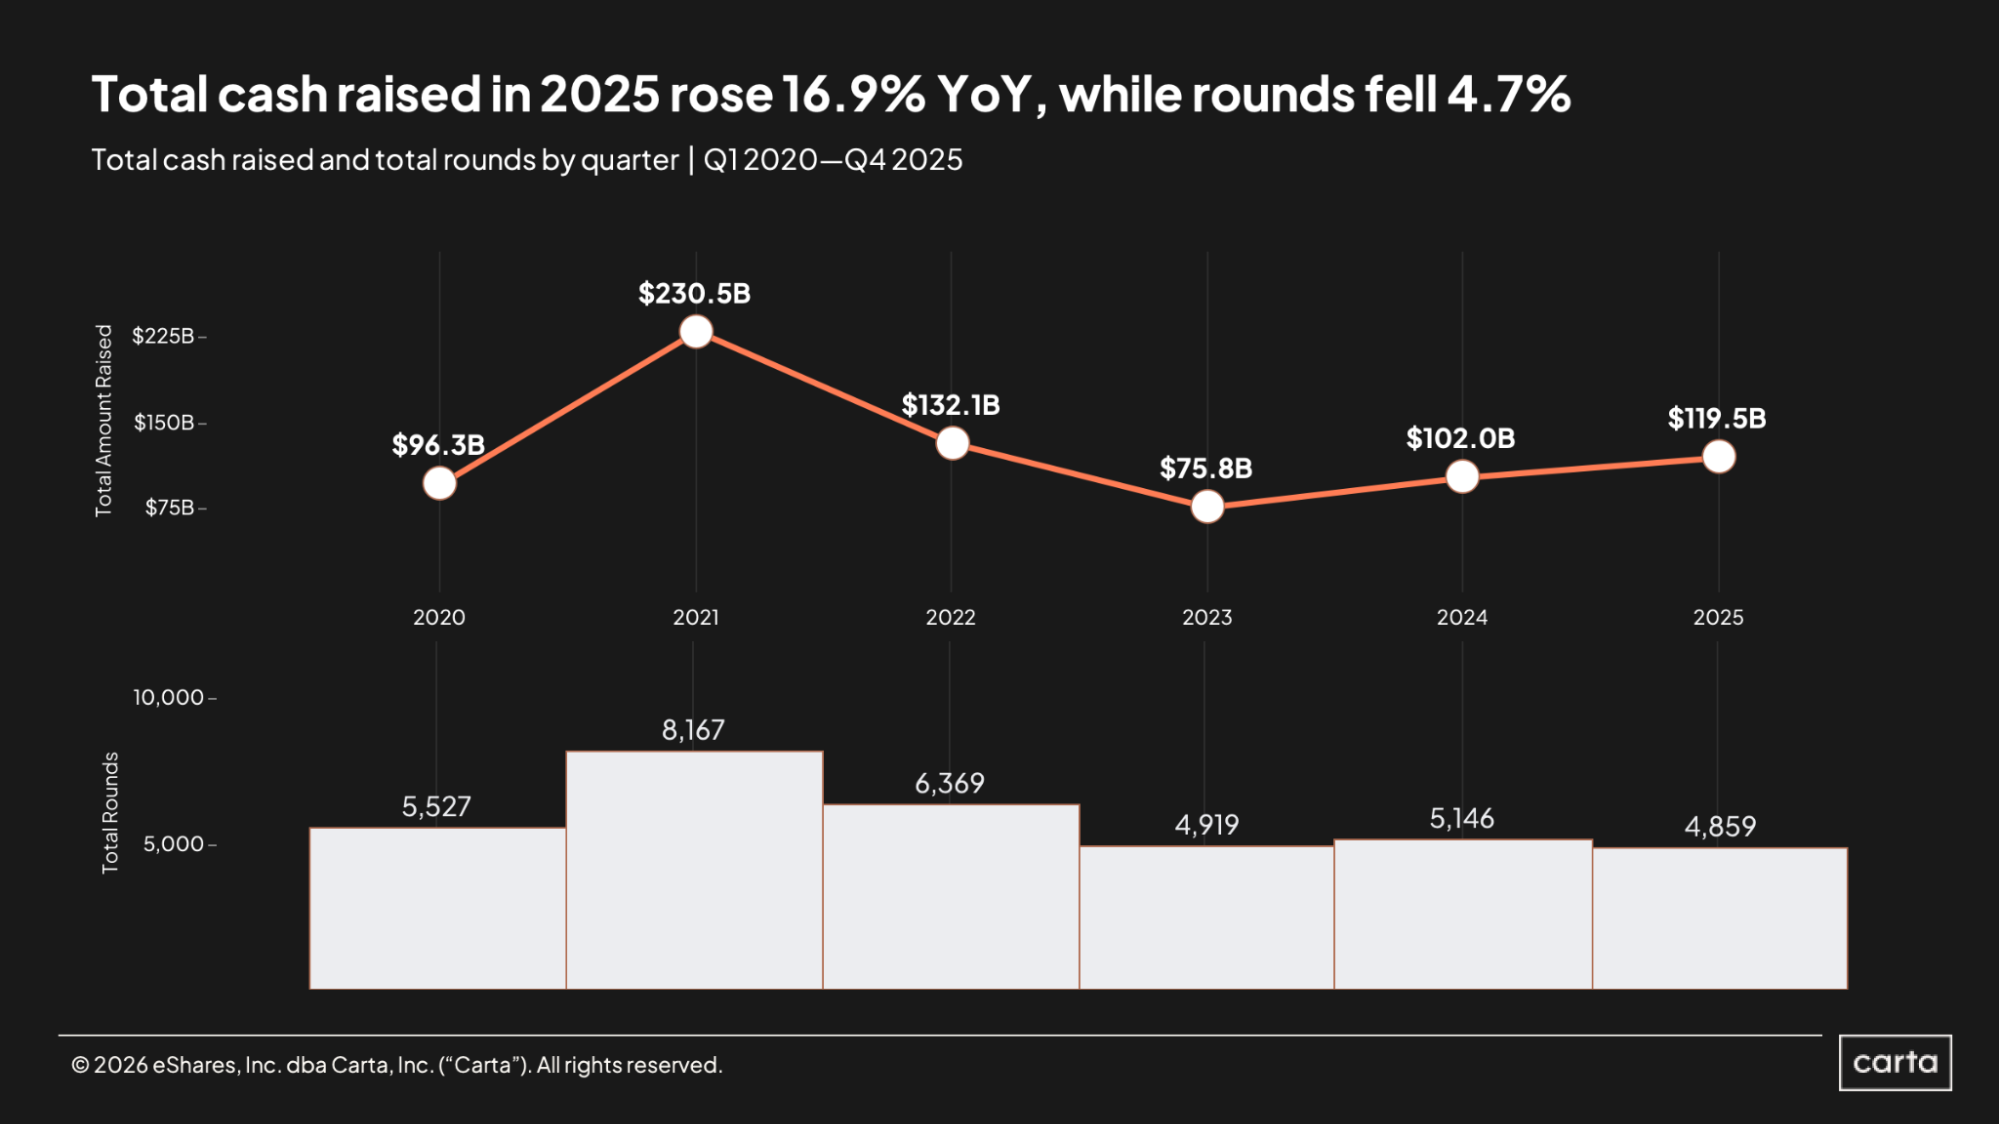
For the second year in a row, total capital investment on Carta increased significantly in 2025. Startups combined to raise $119.5 billion in new funding, a 16.9% increase year over year. Compared to two years ago, cash raised is up 58%.
This surge reflects an increasing concentration of capital into fewer rounds, driven in part by AI, a capital-intensive space that has absorbed a disproportionate share of recent mega-raises. Last year’s total of 4,859 new rounds was the lowest annual sum in at least the past six years, and it’s down 41% from the recent high point of deal activity in 2021.
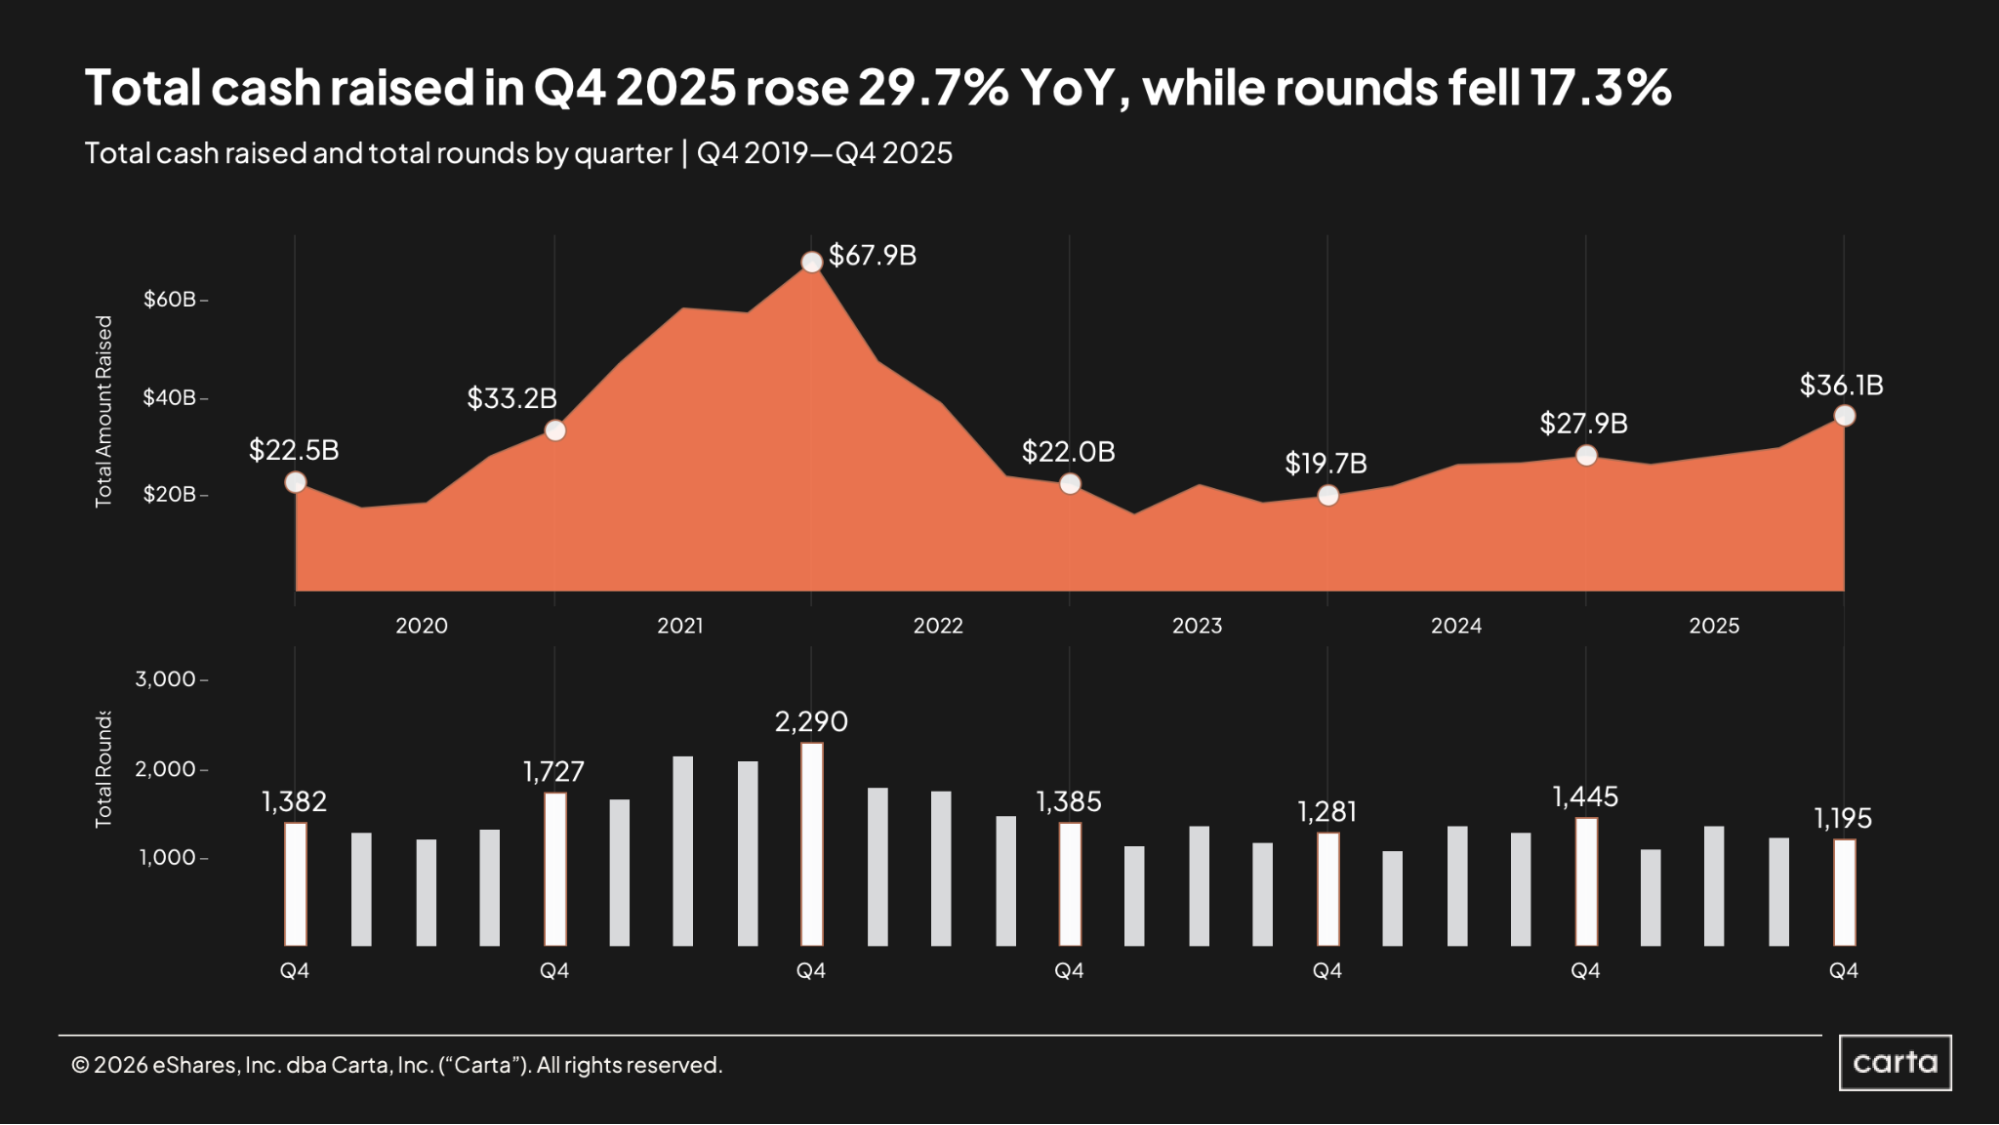
The last quarter of 2025 was the most lucrative stretch for venture fundraising on Carta in several years, with $36.1 billion in total cash raised. That’s up 22% on a quarter-over-quarter basis and close to 30% year over year. The last time quarterly fundraising reached such a high bar was Q2 2022, at the tail end of the record-setting bull market of the early 2020s.
With just 1,195 transactions closed, capital in Q4 was spread across a relatively low number of rounds—the lowest total for any Q4 so far this decade. Across all industries and all stages of fundraising, average round size in Q4 climbed to $30.2 million, a notable increase from $19.3 million in the same period a year prior.
Fundraising volumes
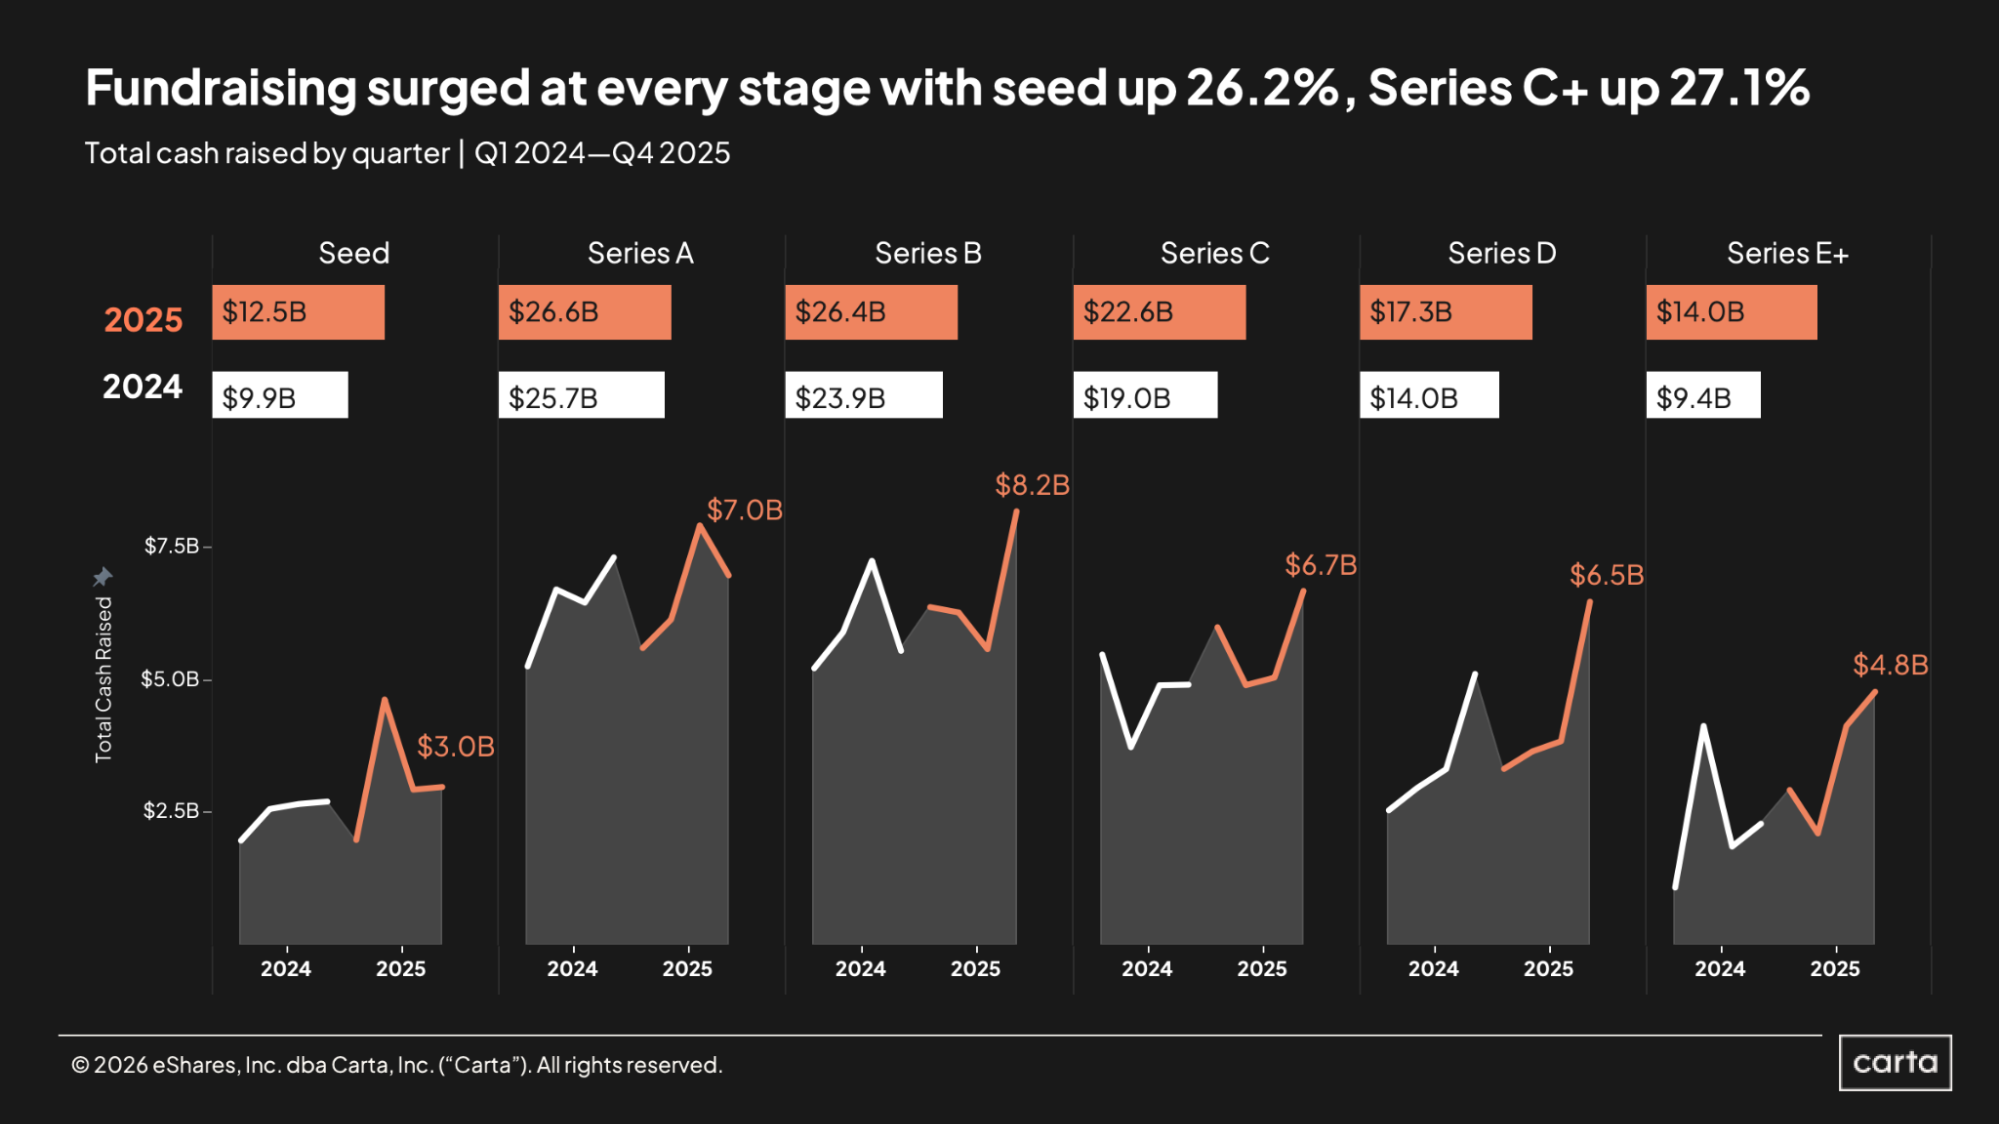
Across every stage, startups raised more capital in 2025 than in 2024. Much of the increase was concentrated in the later stages: Capital raised at Series E and beyond surged 49% in 2025, reaching $14 billion, while Series D investment rose 24% year over year. After falling sharply during the market slowdown of late 2022 and 2023, the late-stage funding landscape has recovered.
Besides Series E+, the next-largest annual gains came at seed, where total capital deployment on Carta climbed by 26% year over year.
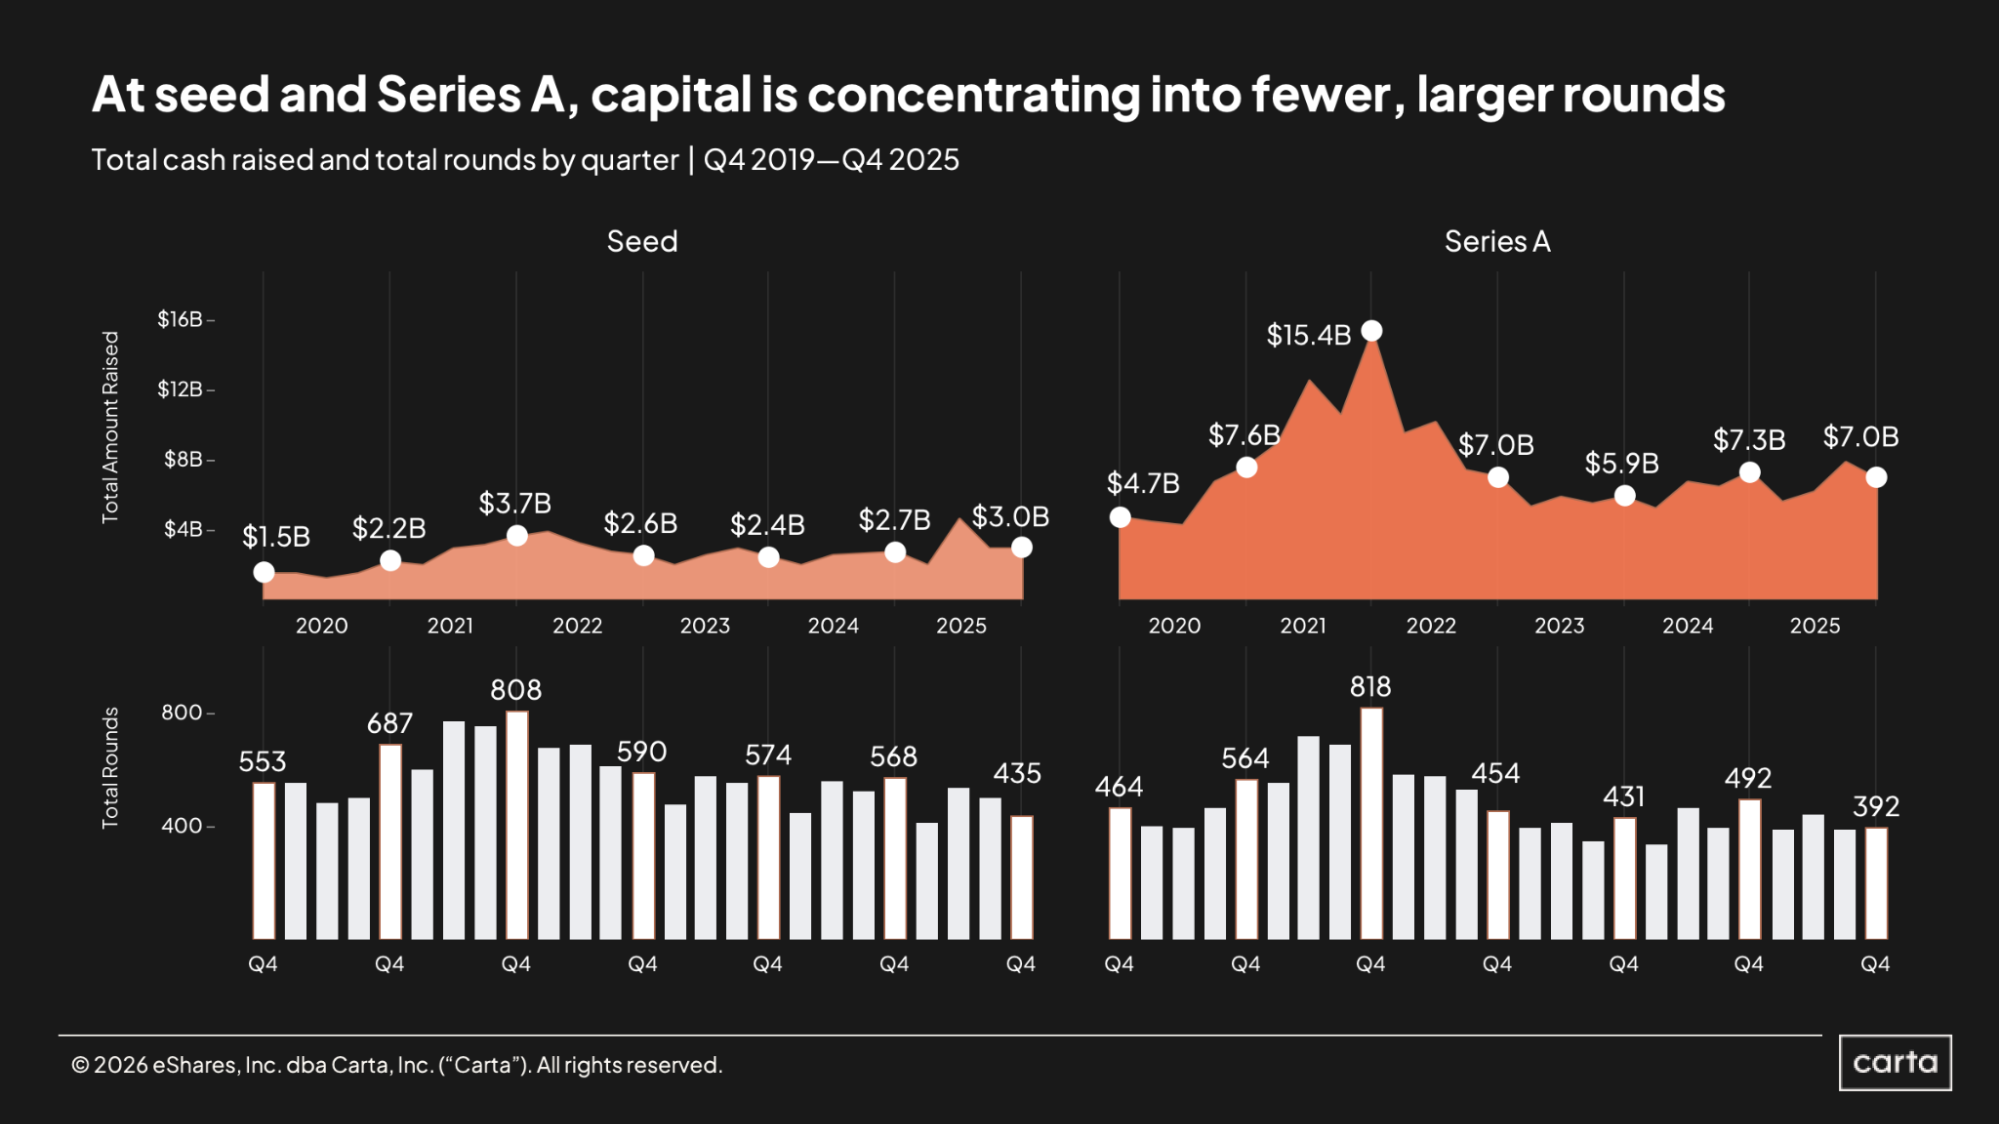
At both the seed stage and Series A, the story over the past few years has been similar. Cash raised has been on the rise, as the market bounces back nicely from a sharp decline in funding that occurred in 2022 and 2023. But deal counts have been on the decline, falling close to recent lowpoints in Q4.
At seed, the $3 billion in new cash raised in Q4 represented a 10% year-over-year climb. The 435 rounds that were closed, however, were down 23% from the previous year. At Series A, startups on Carta raised $15 billion across Q3 and Q4 combined, the highest six-month total since mid-2022. Yet Series A deal counts remained below 400 in both Q3 and Q4, the first time this decade that deal count dipped so low in back-to-back quarters.
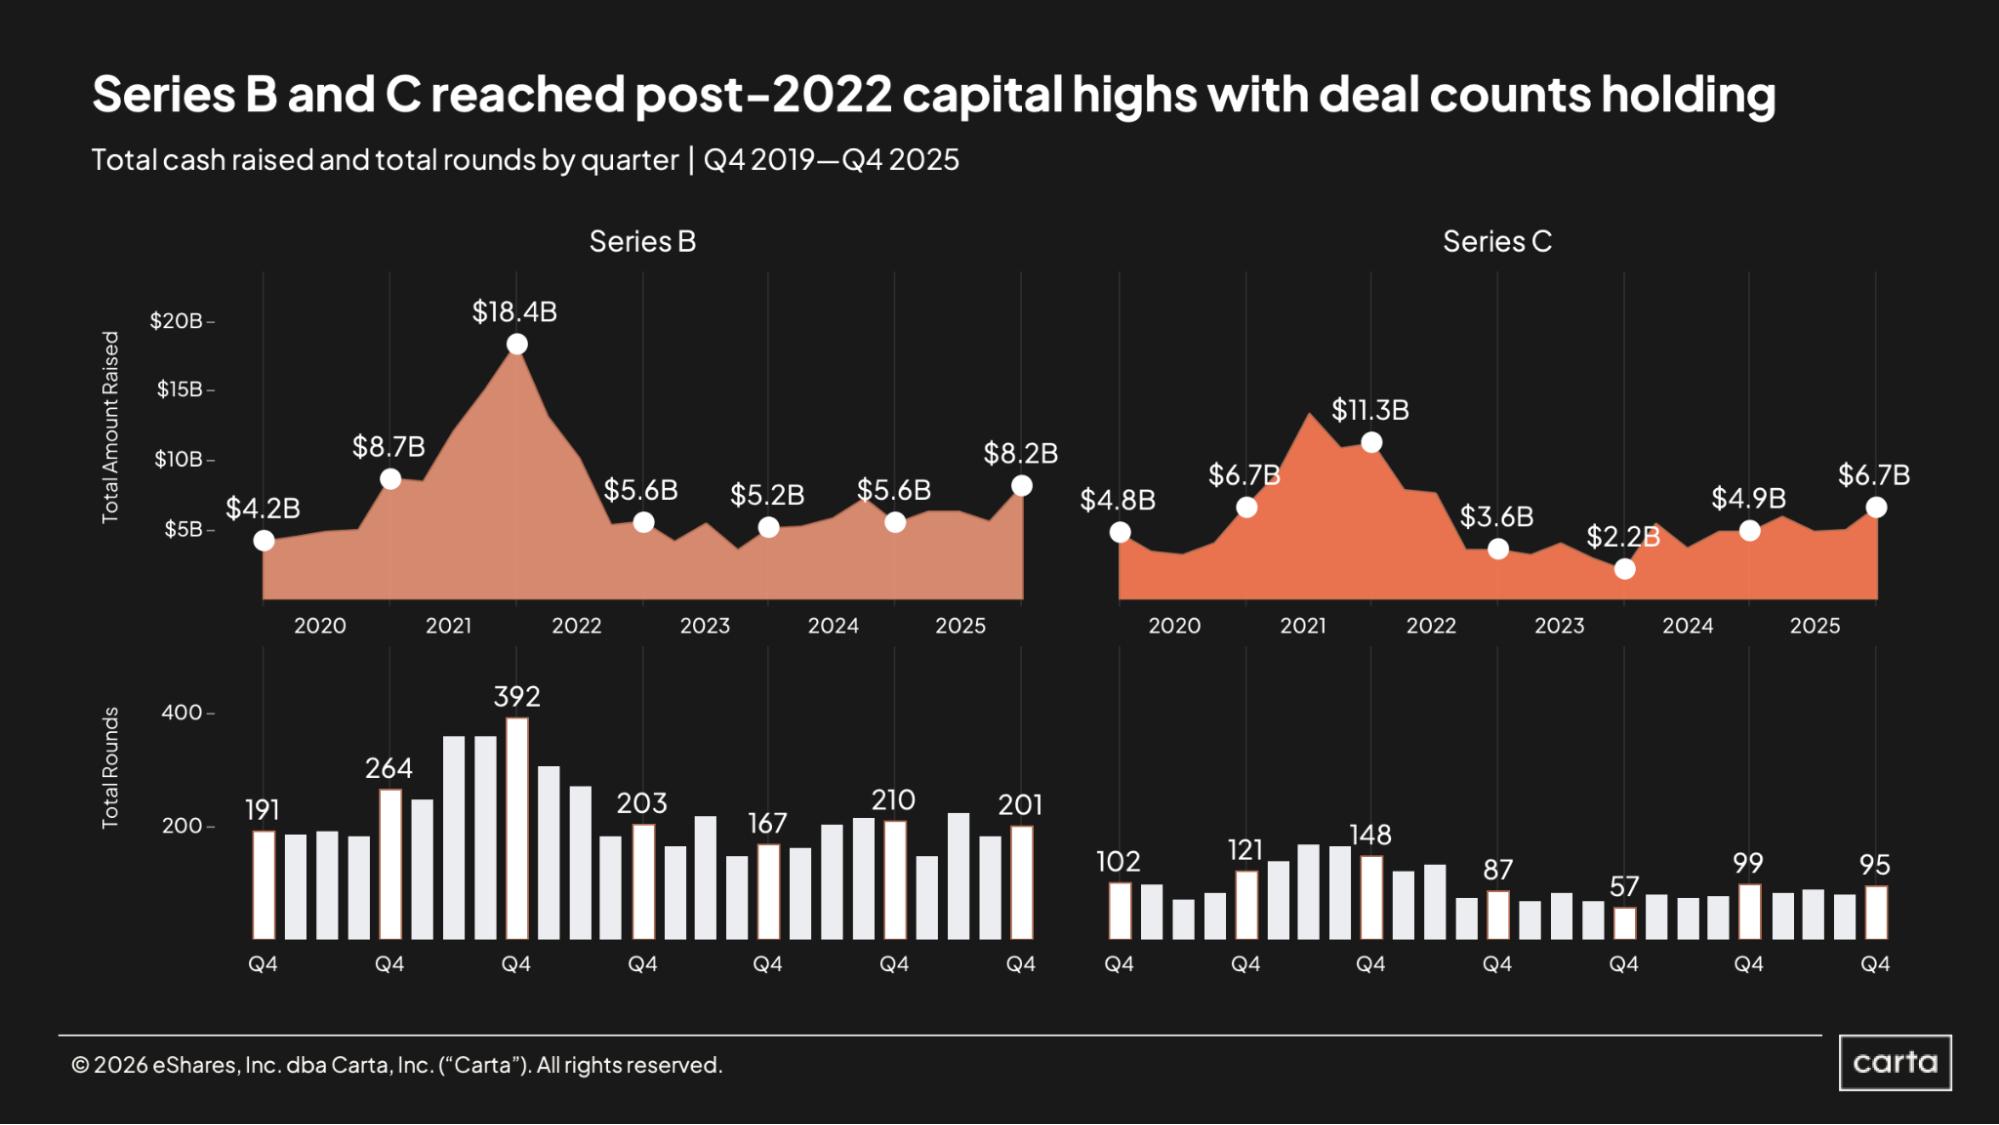
The Series B and Series C markets both ended the year on a lucrative note. Startups on Carta closed $8.2 billion worth of new Series B deals and $6.7 billion in Series C transactions in Q4. In both cases, those were the highest quarterly totals since Q2 2022.
In contrast to earlier stages of fundraising, deal counts at Series B and Series C have been holding steady or gently rising in recent years, depending on the specific time frame. Compared to two years ago, Q4 deal count was up 20% at Series B in 2025 and up 67% at Series C.
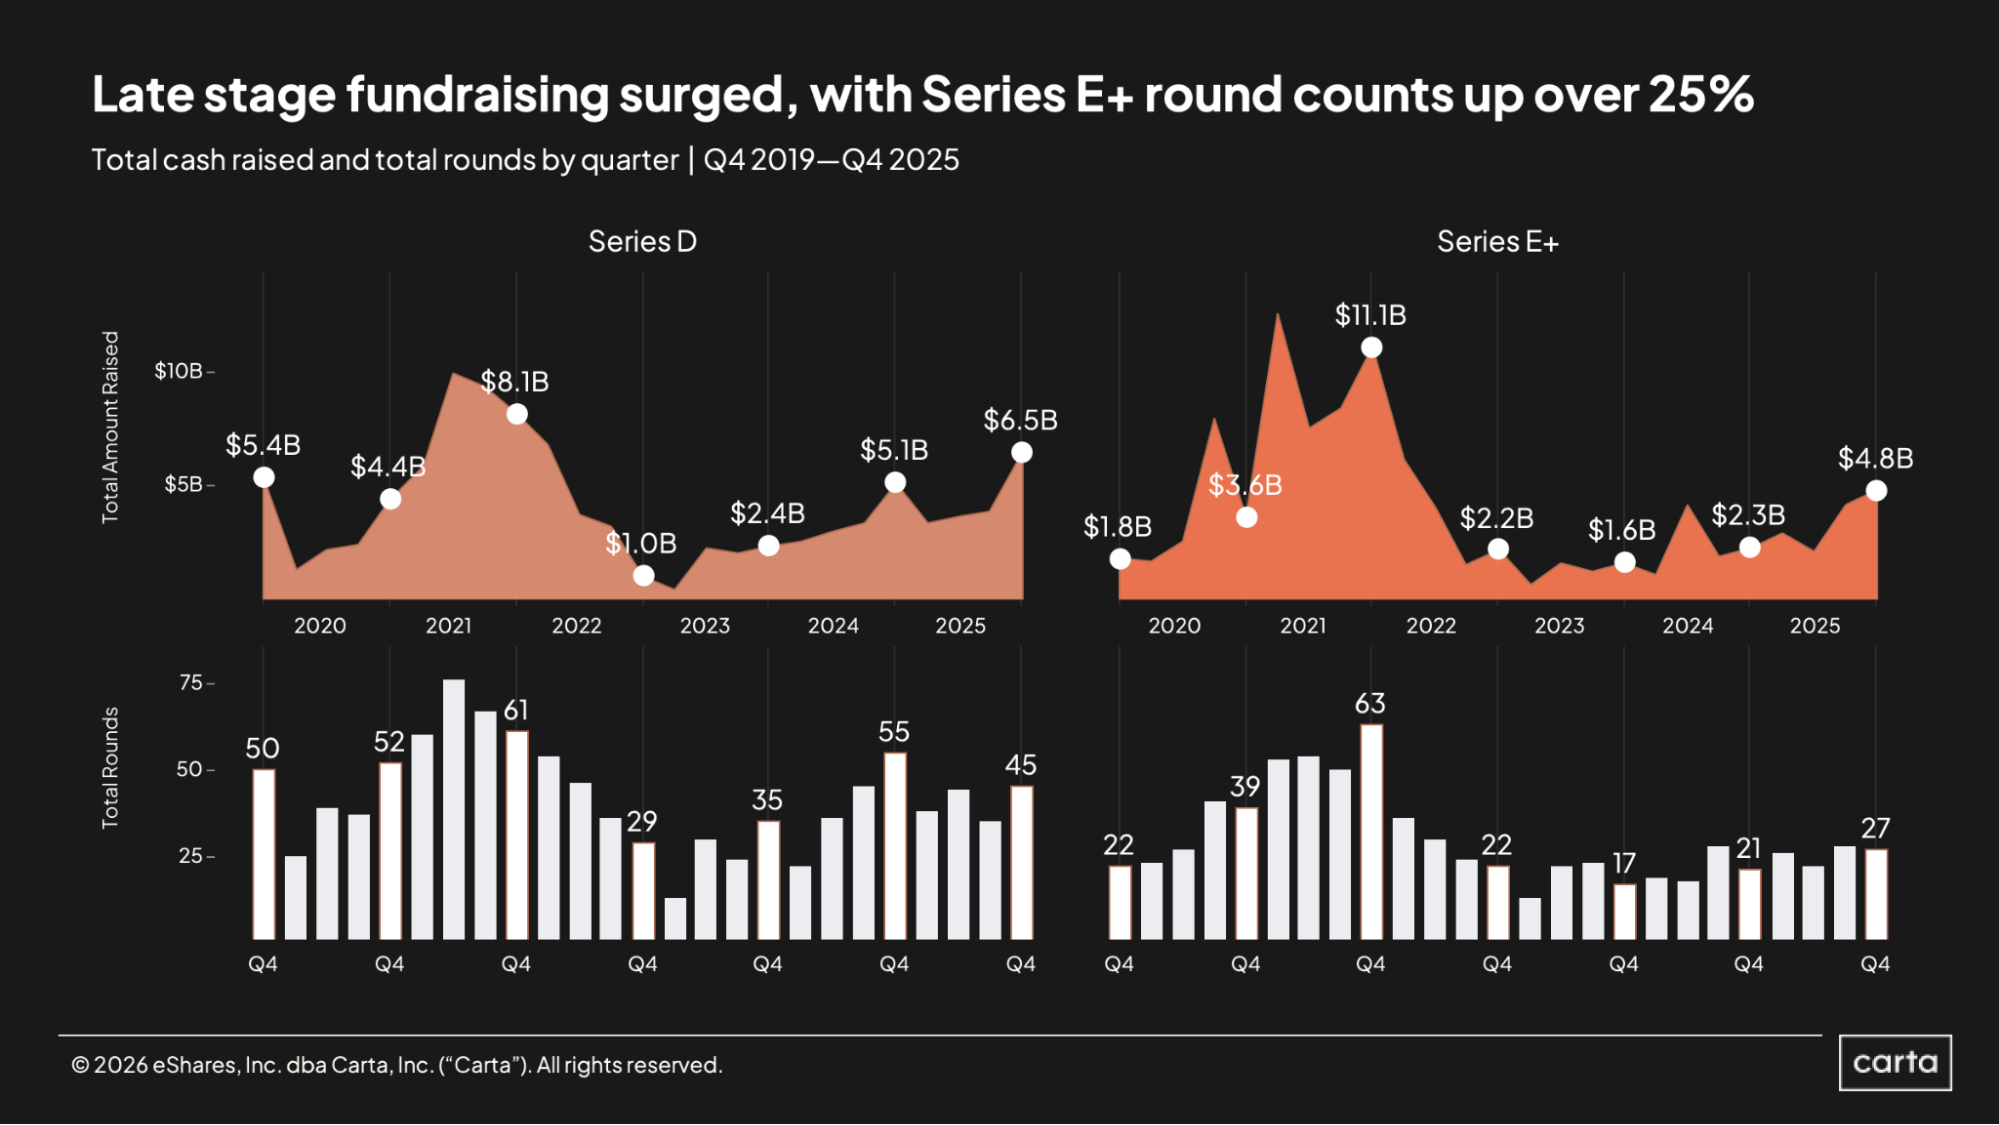
It was also a historically good Q4 for fundraising at both Series D and Series E+. Series D startups on Carta collected $6.5 billion in new funds, up 68% year over year, while startups at Series E and beyond reeled in $4.8 billion, more than doubling the total from Q4 2024. Every stage has seen gains in total capital raised over the past three years, but the increases have been most significant at these later stages.
Deal counts have also trended up in the past two years, but not to the same degree, indicating that increases in cash raised are due more to increases in round size than to any widespread shift in investor demand for late-stage deals. Average Series D round size landed at $144 million in Q4 2025, up from $92.7 million in the same period last year.
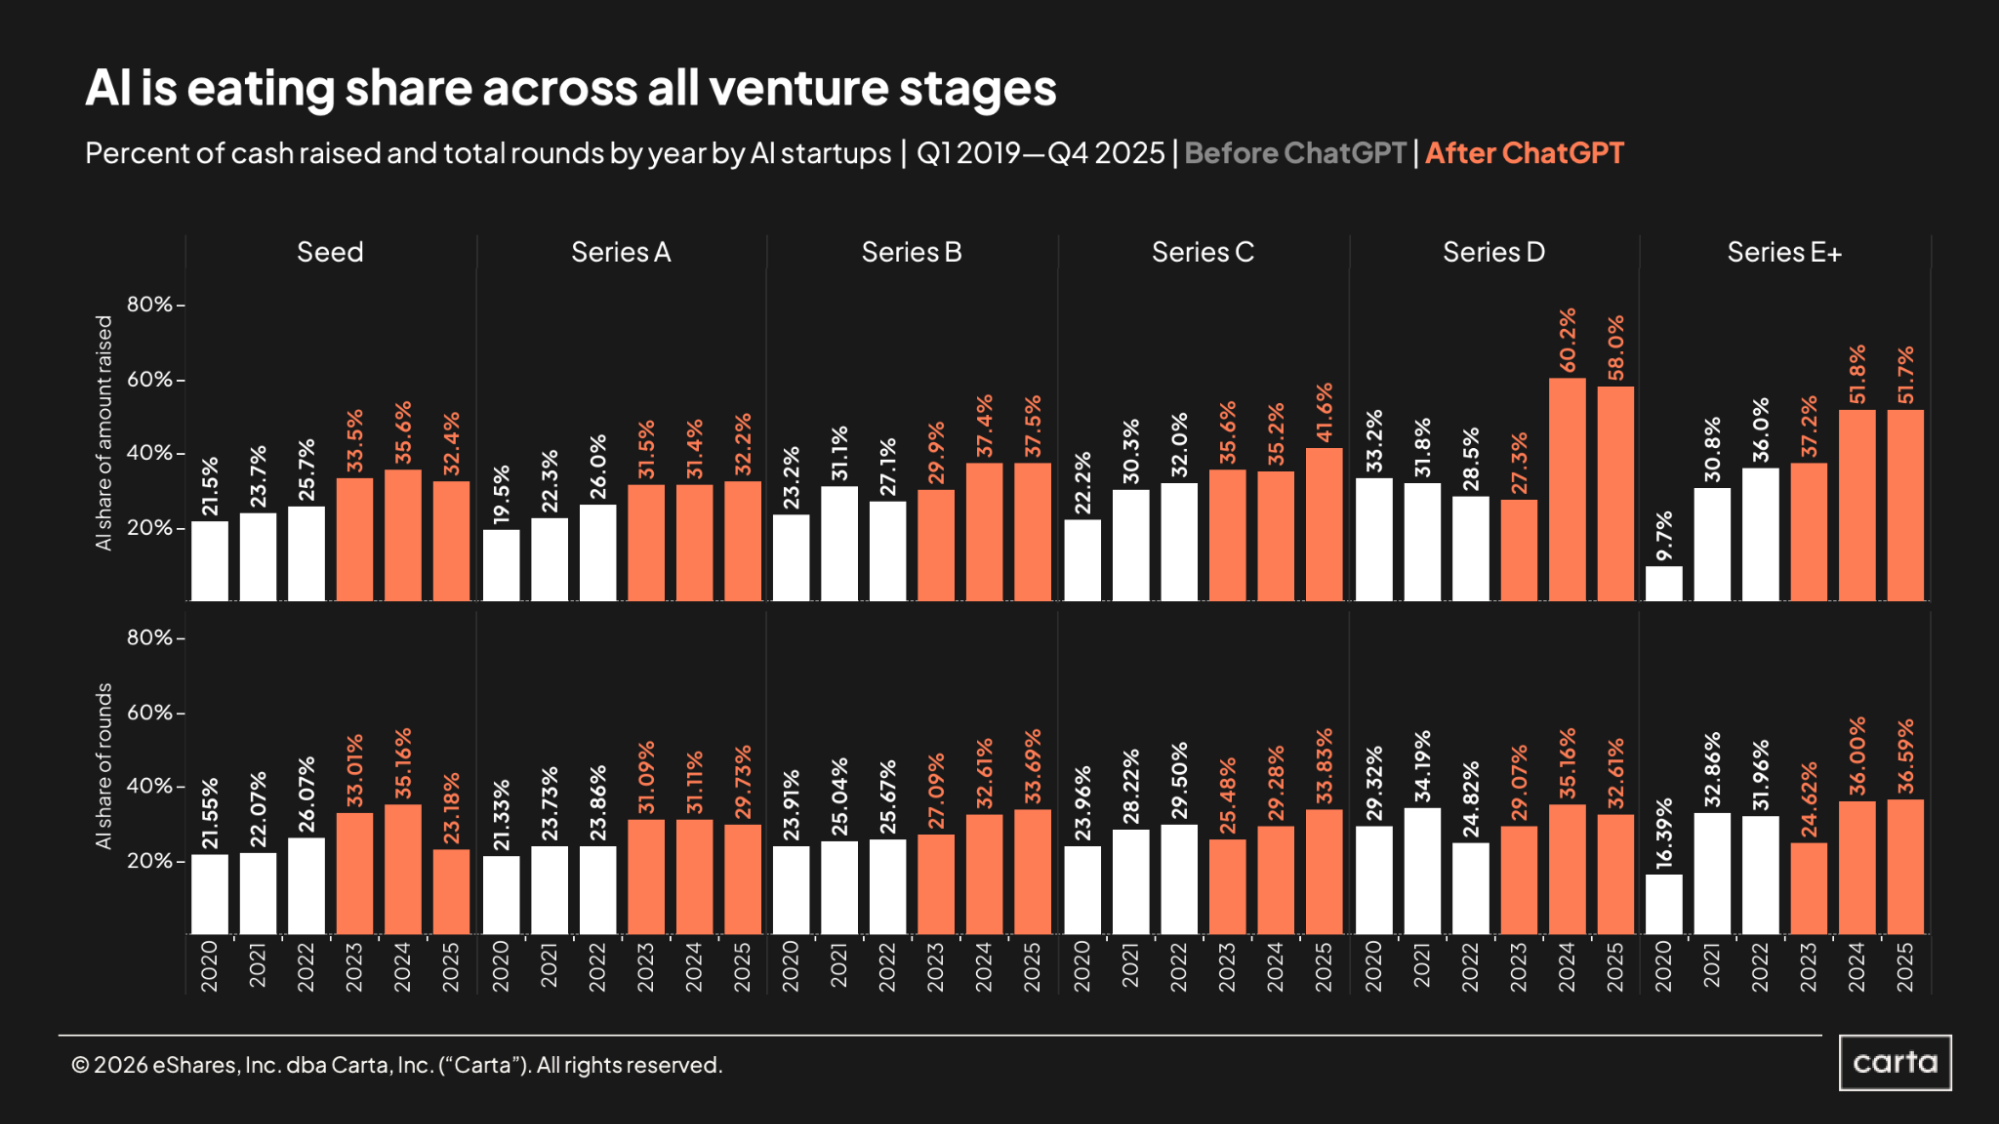
The aforementioned increases in capital raised at the latest stages of startup life have been spurred by AI. In 2025, 58% of all cash raised on Carta at Series D went to AI startups, along with 51.7% of all cash raised at Series E+. Since the public launch of ChatGPT in late 2022, every stage has seen a marked increase in the percentage of all cash raised that’s gone to AI startups. Interestingly, though, these percentages have largely held steady over the past three years at earlier stages. At seed, for instance, AI startups were responsible for a smaller share of fundraising in 2025 than in 2023.
At every stage, the percentage of all dollars raised by AI startups is higher than the AI sector’s percentage of total rounds. At every stage from Series A through Series E+, roughly a third of all rounds closed last year were in the AI sector, give or take a few percentage points.
Deal terms
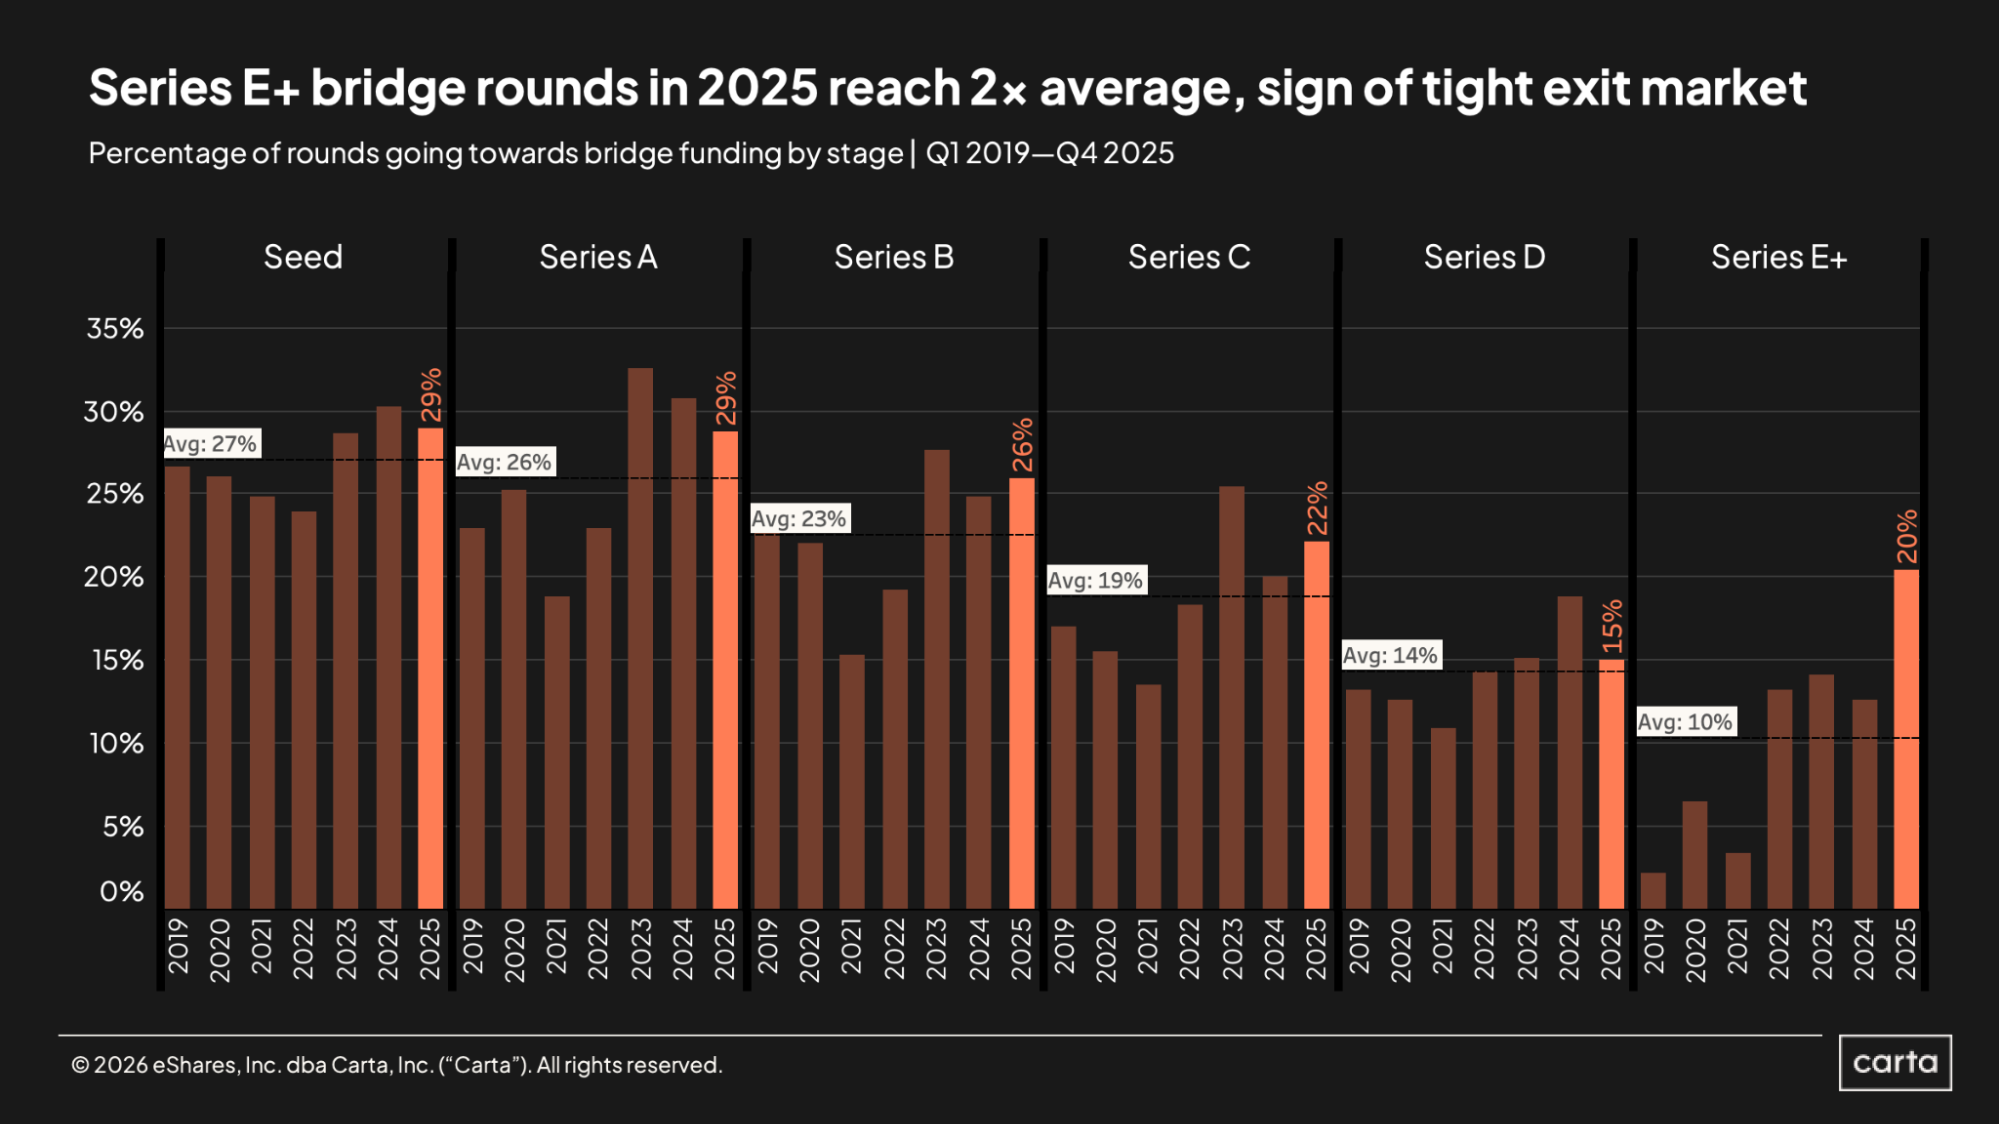
In general, the earlier the fundraising stage, the more prevalent bridge rounds were in 2025. About 29% of all deals at both the seed stage and Series A were bridge fundings last year, which dropped to 26% at Series B, 22% at Series C, and 15% at Series D.
There, however, the trend stalls out. At Series E and beyond, the proportion of bridge rounds rises once again to 20%, two times higher than the average annual rate of bridge rounds at that stage over the past seven years. This is a symptom of ongoing inactivity in the market for IPOs and other exits. With limited options for generating liquidity, a growing proportion of startups are choosing to tide themselves over with bridge capital until the exit climate becomes more welcoming.
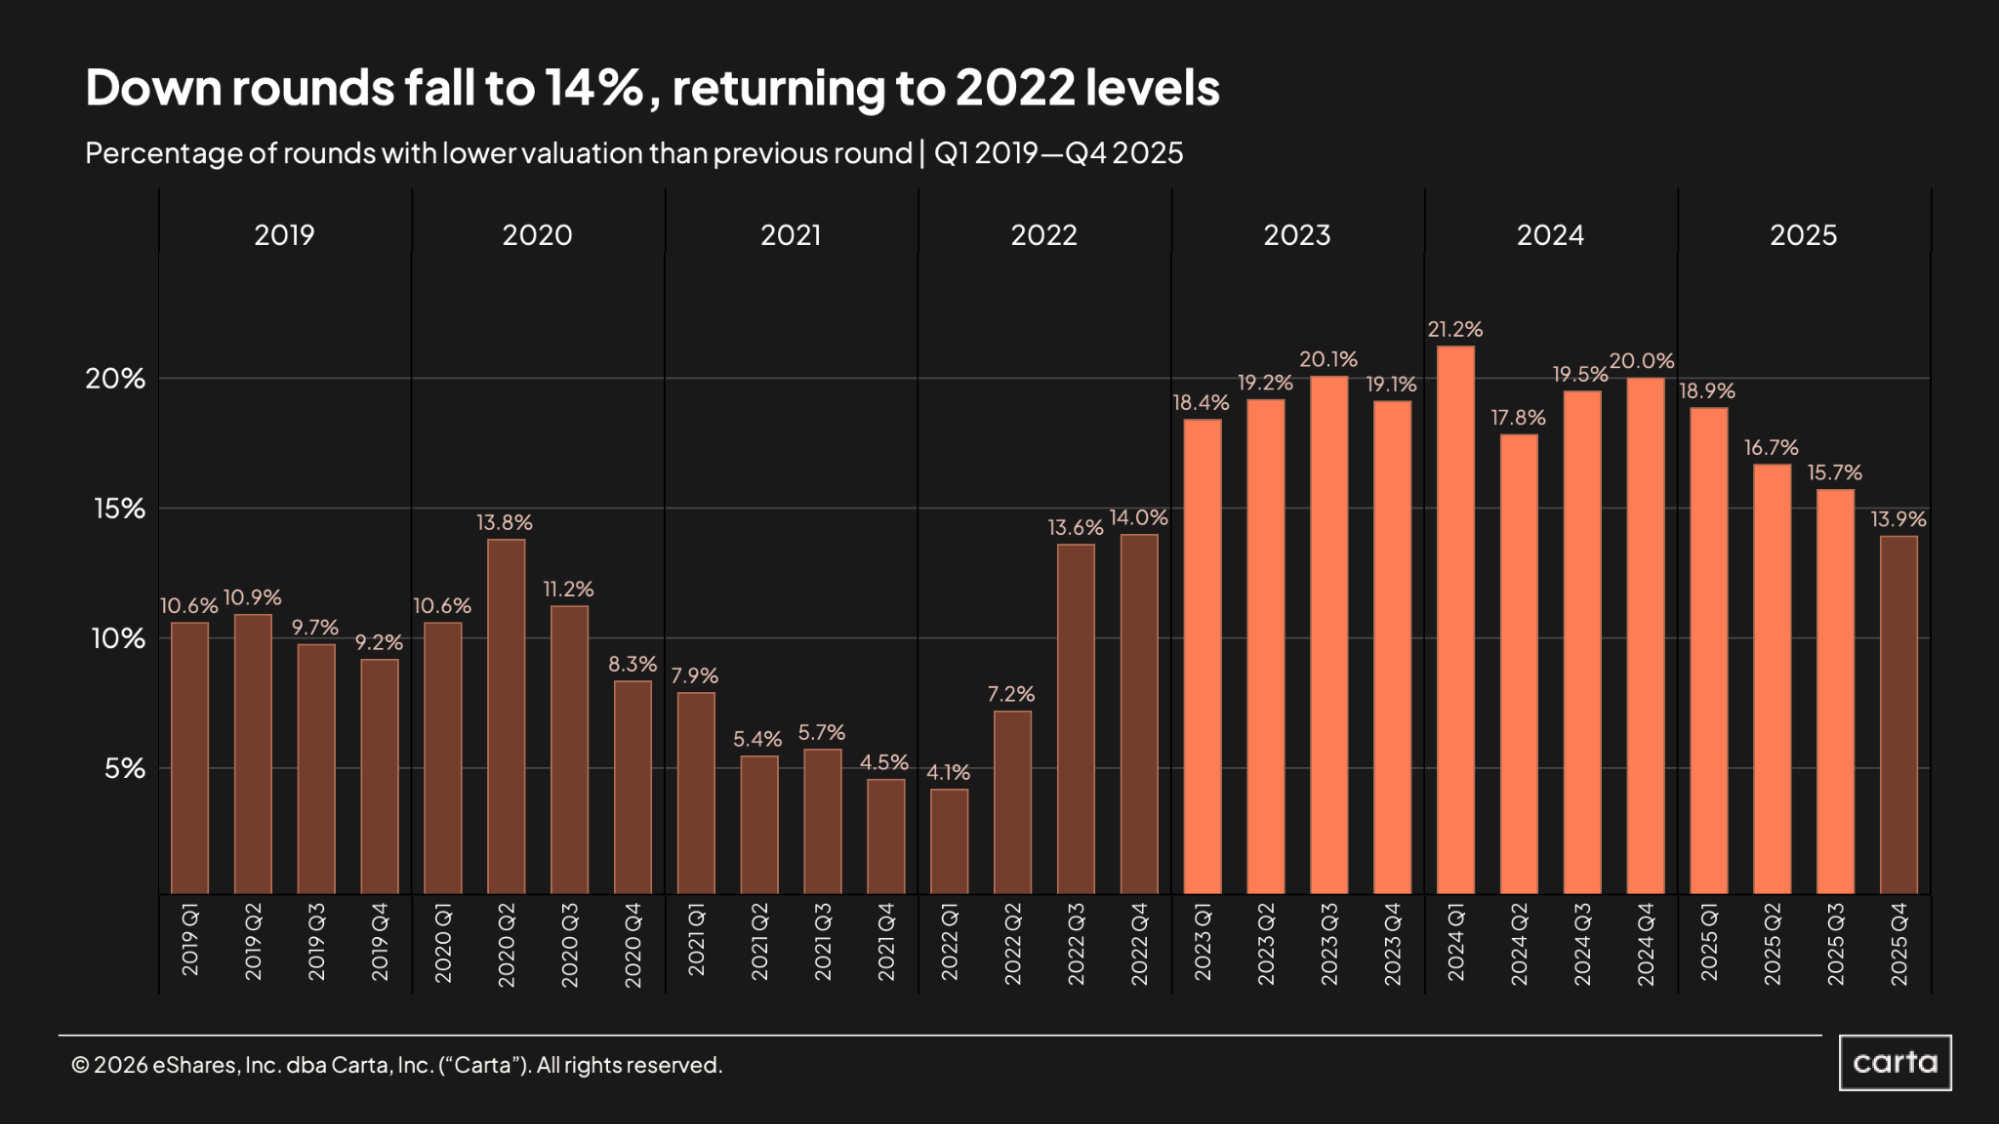
Less than 14% of all rounds raised on Carta in Q4 were down rounds, the lowest quarterly figure since the start of 2023. This ends a streak of 11 consecutive quarters in which at least 15% of new fundraisings were down rounds, including three quarters in which the down-round rate rose to at least 20%.
A widespread valuation reset occurred in both the public and private tech markets during the back half of 2022; for many startups, this changing climate left no choice but to accept a reduced valuation as the cost for raising new capital. Three years on from this market shift, however, the number of companies that are still pegged to pre-reset valuations continues to decline. Today, the post-reset market is just the new normal.
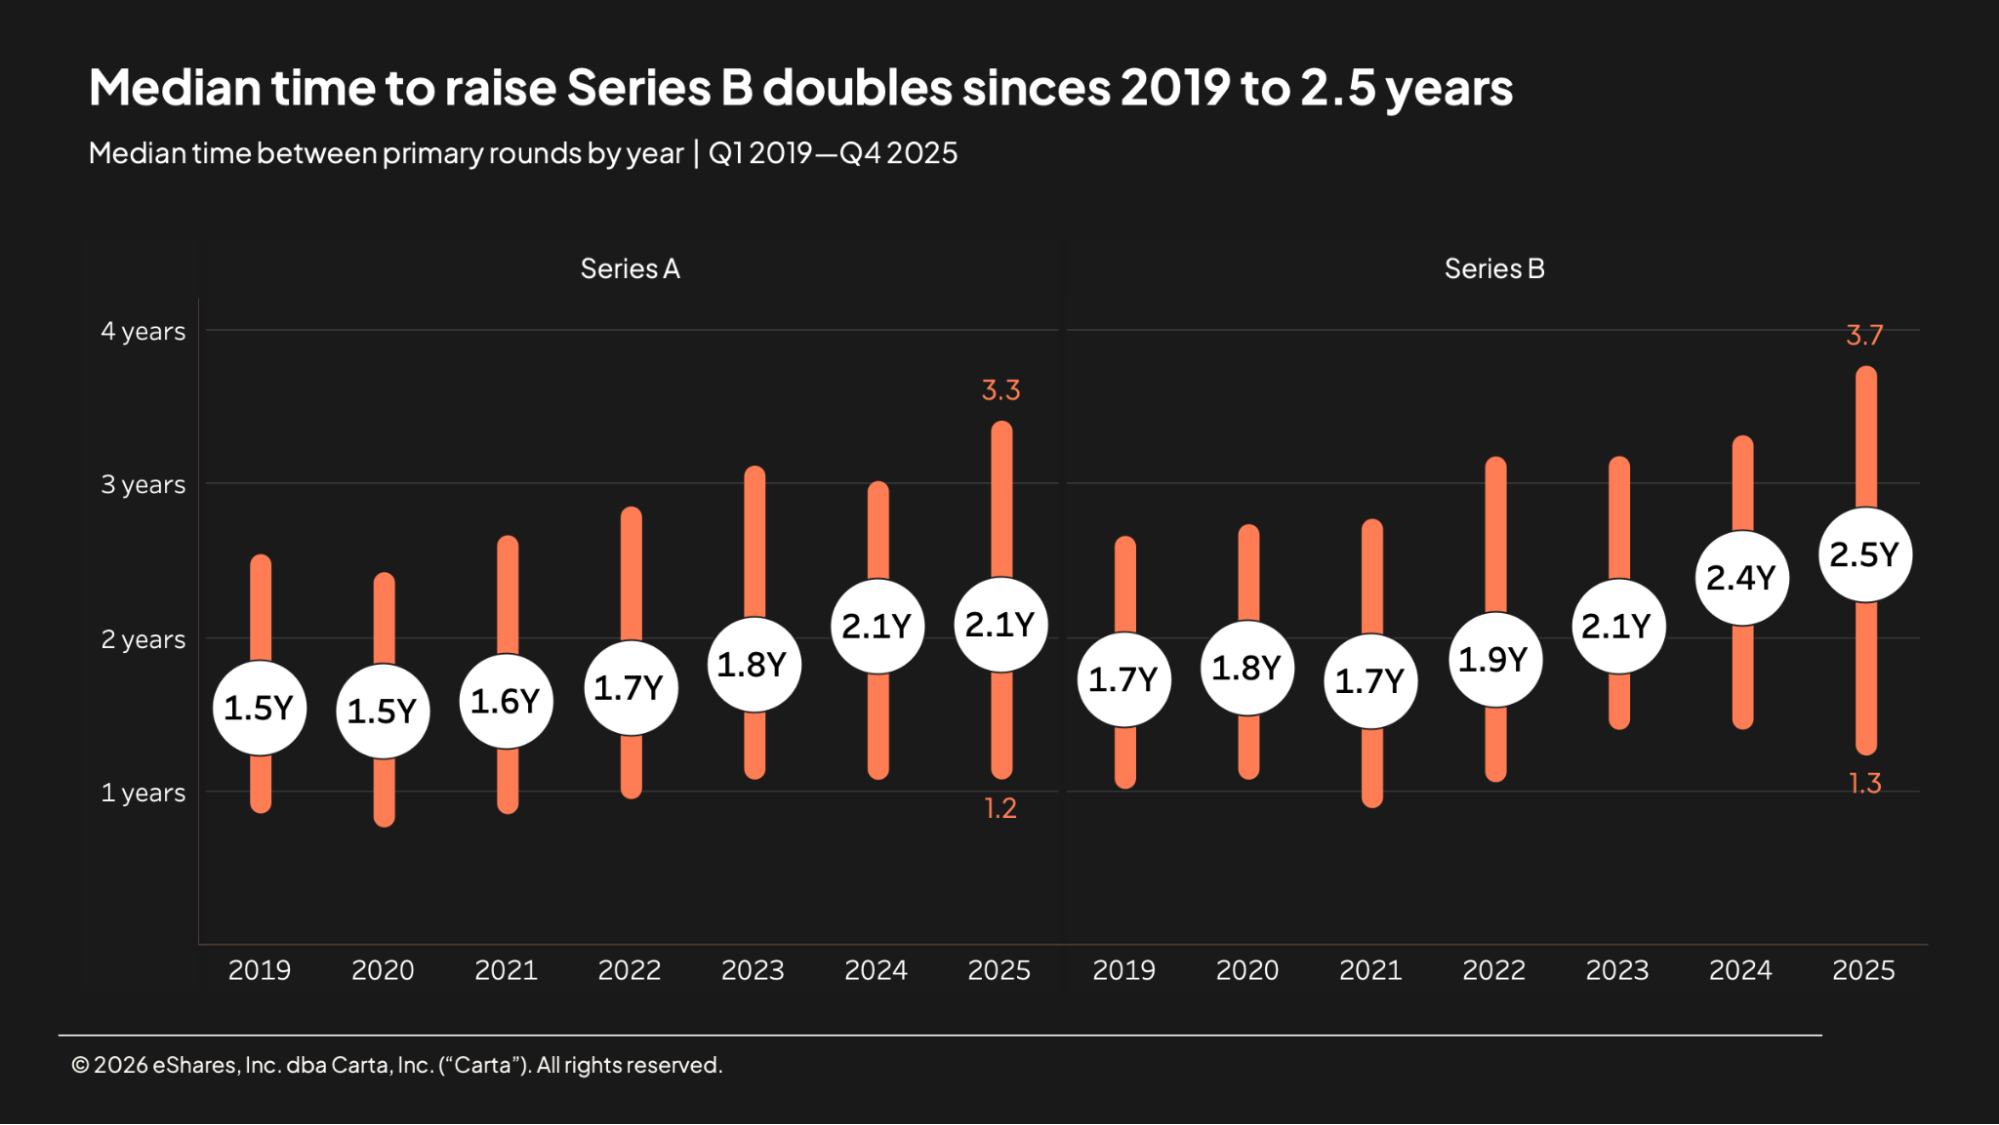
On an annual basis, the typical length of time that startups are waiting to raise their Series A and Series B rounds keeps trending up. The median startup that closed a Series A round last year had waited about 2.1 years since raising their seed round, up from an interval of 1.5 years as of five years ago. The median gap between a Series A and Series B, meanwhile, rose to 2.5 years in 2025, compared to 1.8 years in 2020.
In the chart above, the orange areas mark the minimum and maximum of the median fundraising timeline. To some degree, these lengthening fundraising timelines reflect the aforementioned valuation reset: Faced with a less attractive climate for pricing, some companies are choosing to simply wait it out. But changing startup habits are also a factor. Today, young companies are more likely to prioritize efficiency over growth at all costs, and AI has made it easier than ever to build and scale companies without breaking the bank. These twin trends are contributing to longer runways.
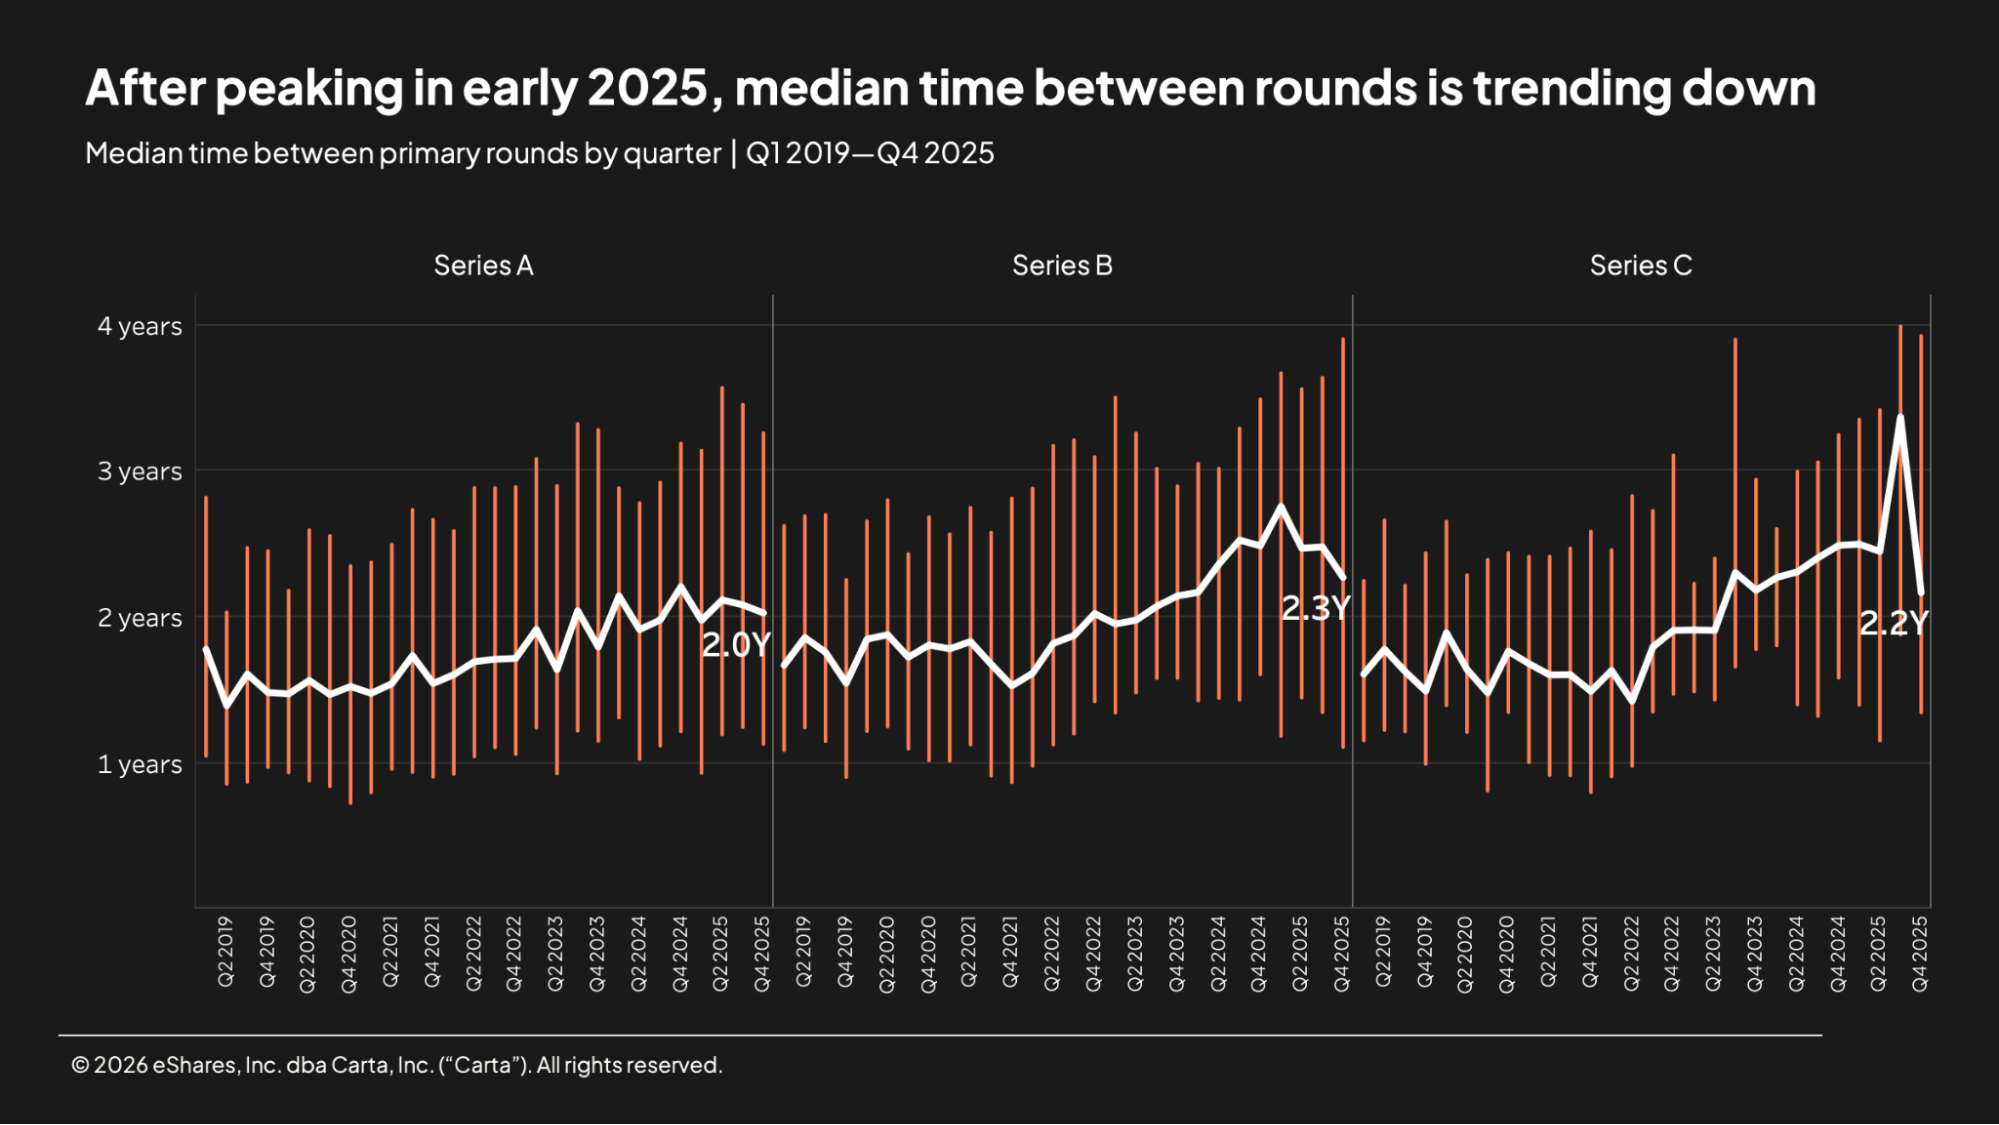
There is some reason to believe that the trend of longer gaps between rounds reflected in the above annual data is coming to an end. On a quarterly basis, the median time between rounds declined in Q4 at each of Series A, Series B, and Series C, with the latter two stages in particular experiencing sizable dropoffs.
The gaps between the 25th percentile and 75th percentile for each of these stages remain wide—roughly two years at both Series B and Series C—reflecting the broad range of realistic timelines currently seen in the market. Several notable AI startups have raised multiple large recent rounds in rapid succession, signaling that the most attractive companies are able to progress through the fundraising cycle significantly faster than most.
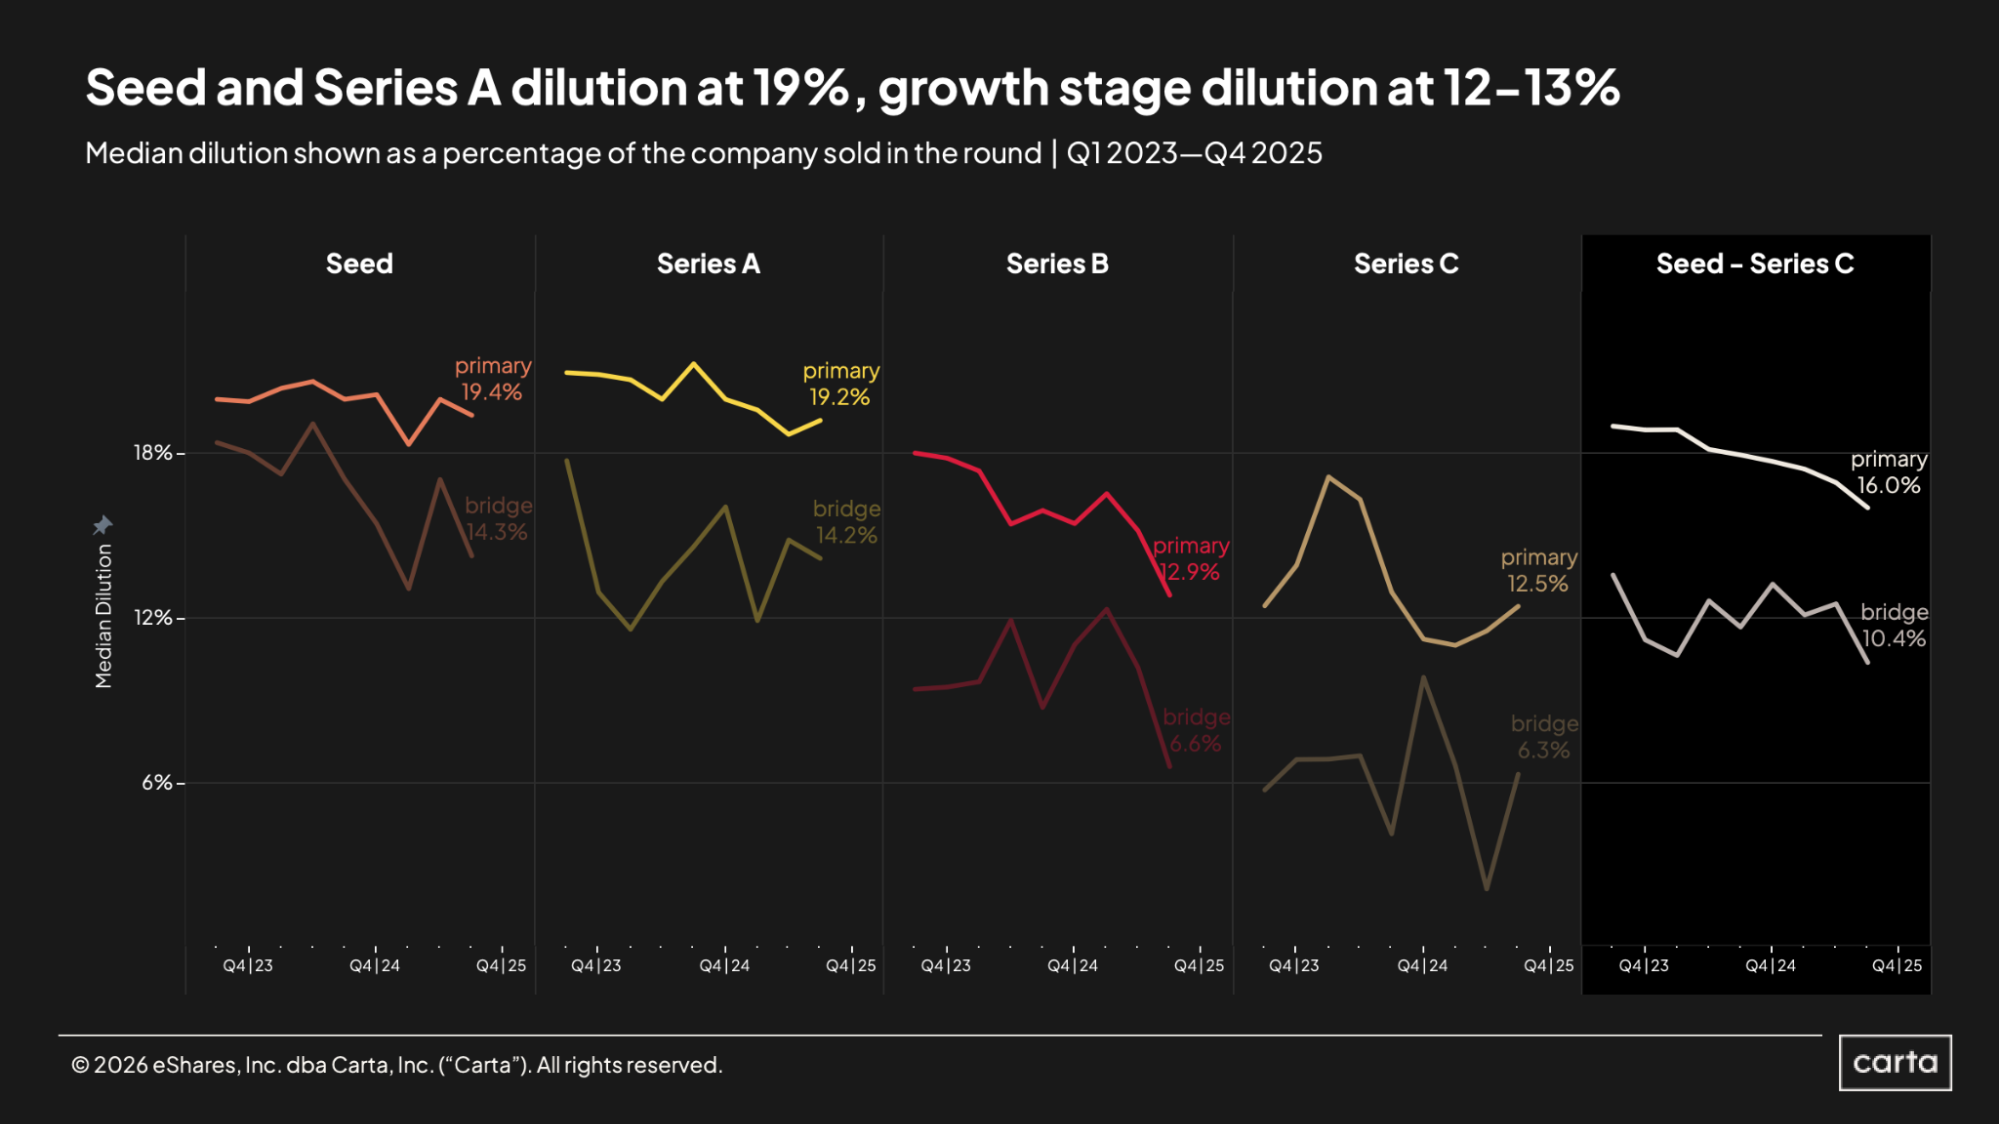
The general trend is clear: Compared to two years ago, the typical startup fundraising on Carta involves less dilution than it used to. Across all stages from seed through Series C, median dilution on primary rounds raised in Q4 2025 was just 16%, compared to median dilution of about 19% in Q4 2023.
This dropoff in dilution has been more pronounced at some stages than others. Median dilution at Series B has fallen off a cliff, dropping all the way from 18% two years ago to 12.9% in Q4 2025. At Series C, meanwhile, median dilution is essentially the same as it was two years ago, even with some significant swings in the interim. Reduced dilution is typically seen as a positive for startups and their executives: The less dilution a round entails, the higher the percentage of company equity the founders are able to retain.
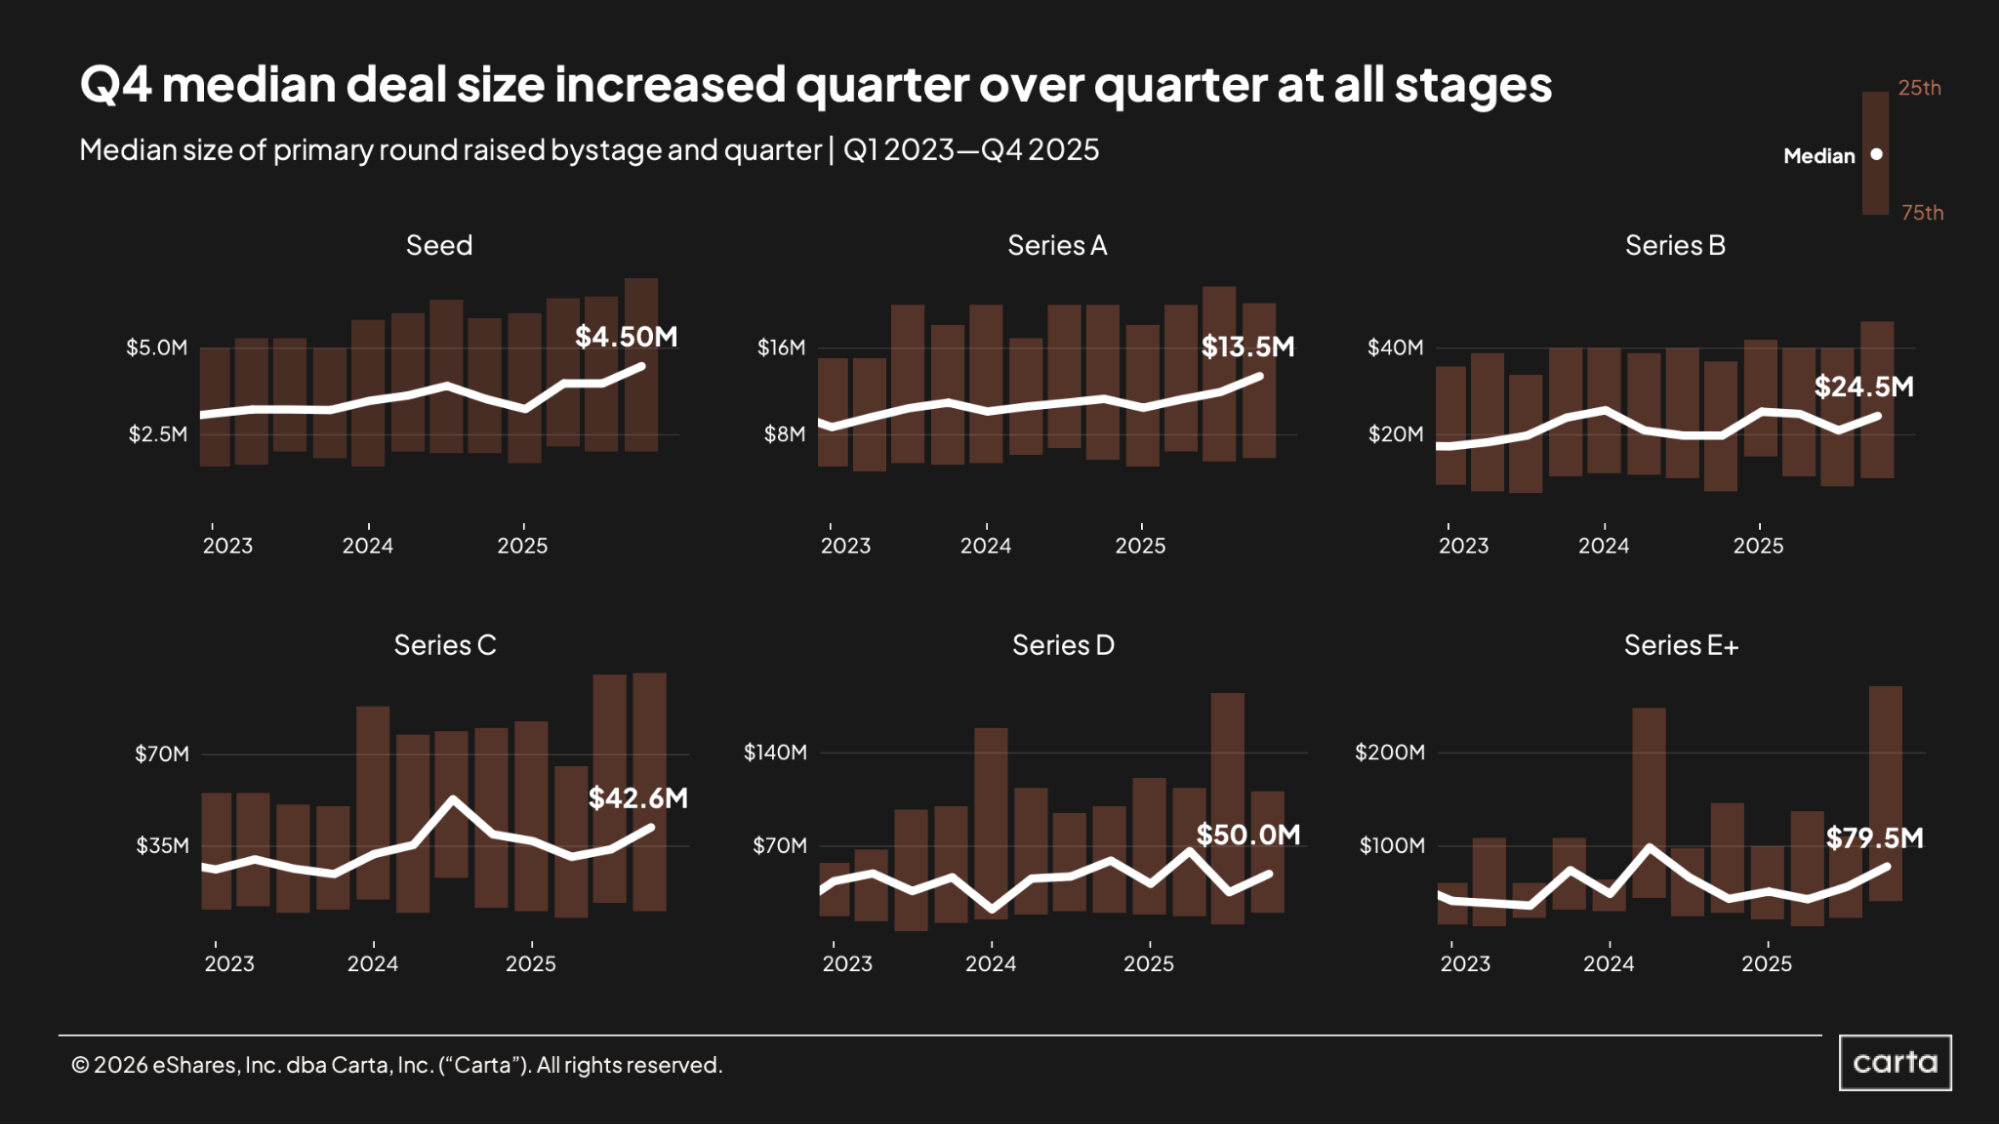
Median round sizes got larger at every stage of startup life in Q4 2025. At the earliest stages, they rose to new record highs: The median seed deal totaled $4.5 million in Q4, a 27% year-over-year increase, and the median Series A round size reached $13.5 million, up 18% year over year.
In terms of annual growth, however, Series E+ outpaces them all. At these latest fundraising stages, the median round size jumped to $79.5 million in Q4, a 76% annual increase. Overall, the Series E+ funding market ended the year on a high note, with median valuations also taking a notable leap.
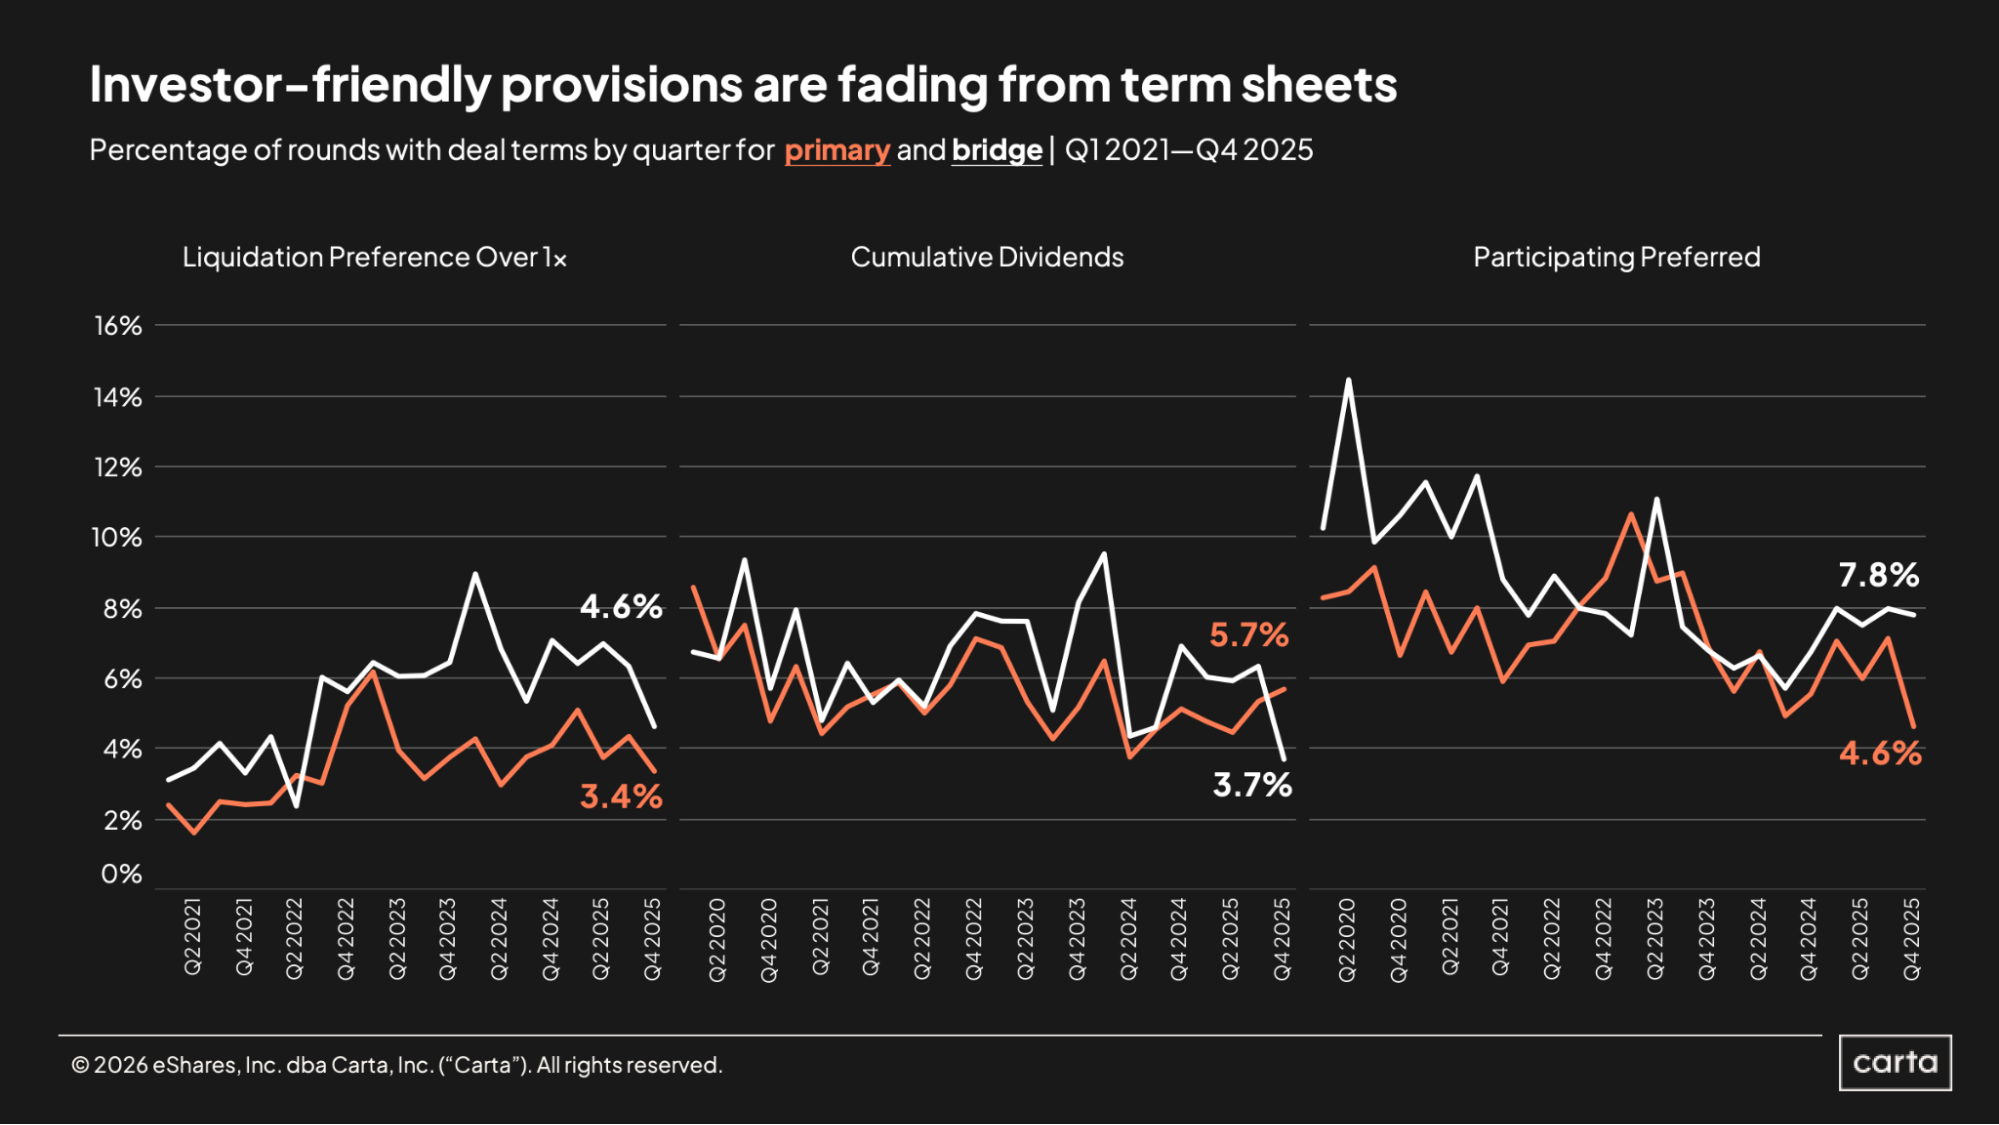
The percentage of primary funding rounds on Carta that included liquidation preferences over 1x fell to 3.4% in Q4, while the proportion of rounds that included participating preferred stock dropped to 4.6%. In both cases, those are the lowest percentages in more than a year. The percentage of primary rounds with cumulative dividends ticked up to 5.7%, but all three of these investor-friendly deal terms remain exceedingly rare.
Both liquidation preferences over 1x and participating preferred stock are a little more likely to show up in bridge rounds, but both are also still uncommon. In particular, bridge financings are more likely to include participating preferred stock, which was the case in 7.8% of Q4 bridge rounds.
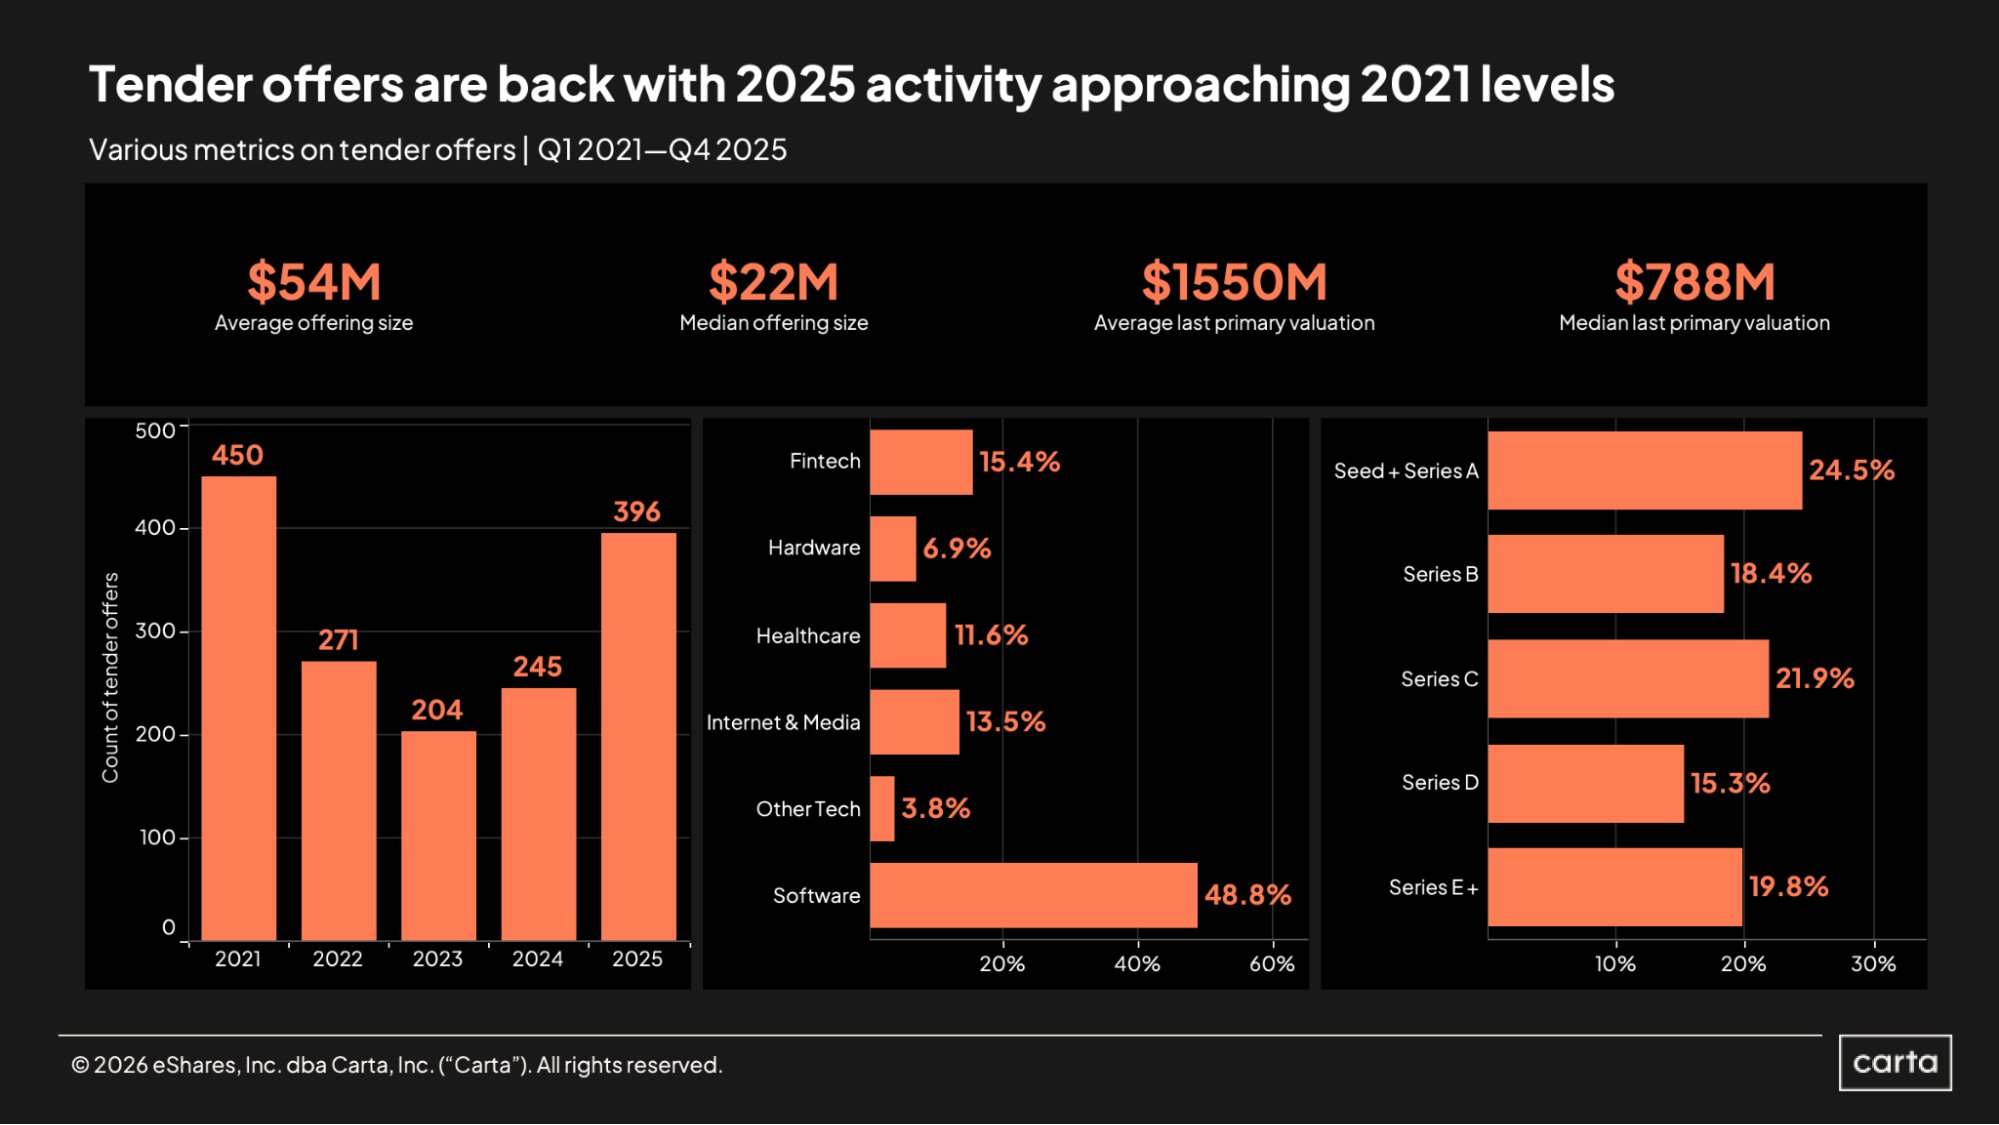
The frequency of tender offers has taken a notable leap. Carta tracked nearly 400 tenders during 2025, marking a 62% year over year increase and the second-highest annual total of the past five years, trailing only 2021, when dealmaking activity of all kinds soared to recent highs. The average size of those 2025 offerings was $54 million, while the median was $22 million. The significant gap between those two figures points to a right-tail distribution, with some outsized offerings pulling the average much higher.
Many of the startups conducting tenders were relatively established: The average post-money valuation of their previous primary funding rounds was $1.55 billion, while the median was $788 million. Some, though, were still quite young: Nearly a quarter of all companies that conducted tenders on Carta last year were either at the seed stage or Series A.
Valuations
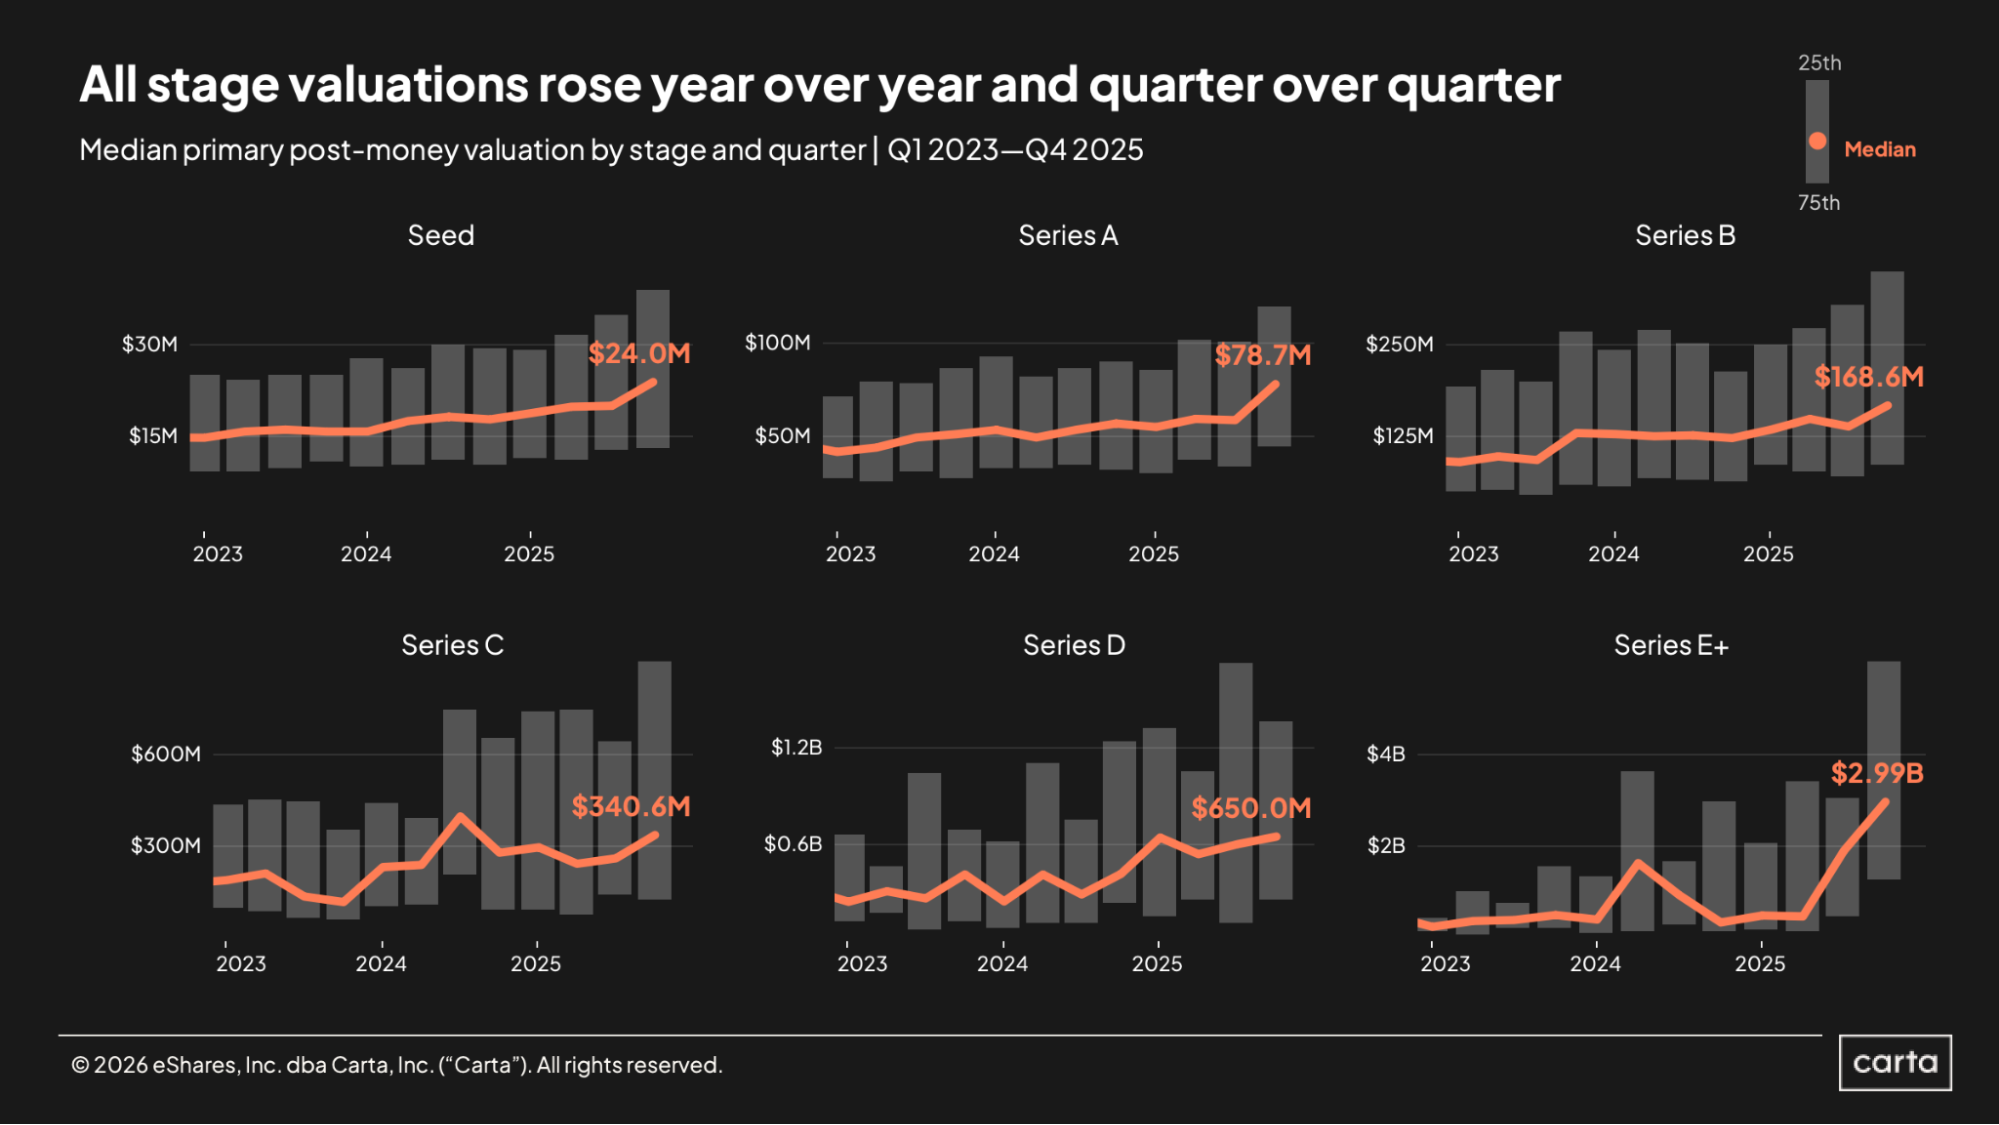
Startup valuations surged in the back half of 2025, with the median post-money valuations climbing at every stage in Q4. The median seed valuation climbed to $24 million, a 33% year-over-year increase, while the median Series A valuation jumped to $78.7 million, a 37% annual rise. At both of these early stages, median post-money valuations rose to all-time highs.
But the most significant growth came at Series E+, where the median valuation skyrocketed to nearly $3 billion—a 667% increase from a year ago, when the median post-money valuation at Series E+ was less than $400 million. The 25th and 75th percentile valuations at Series E+ also rose by large margins, reflecting a pricing shift that extends from the lower end to the upper end of the market.
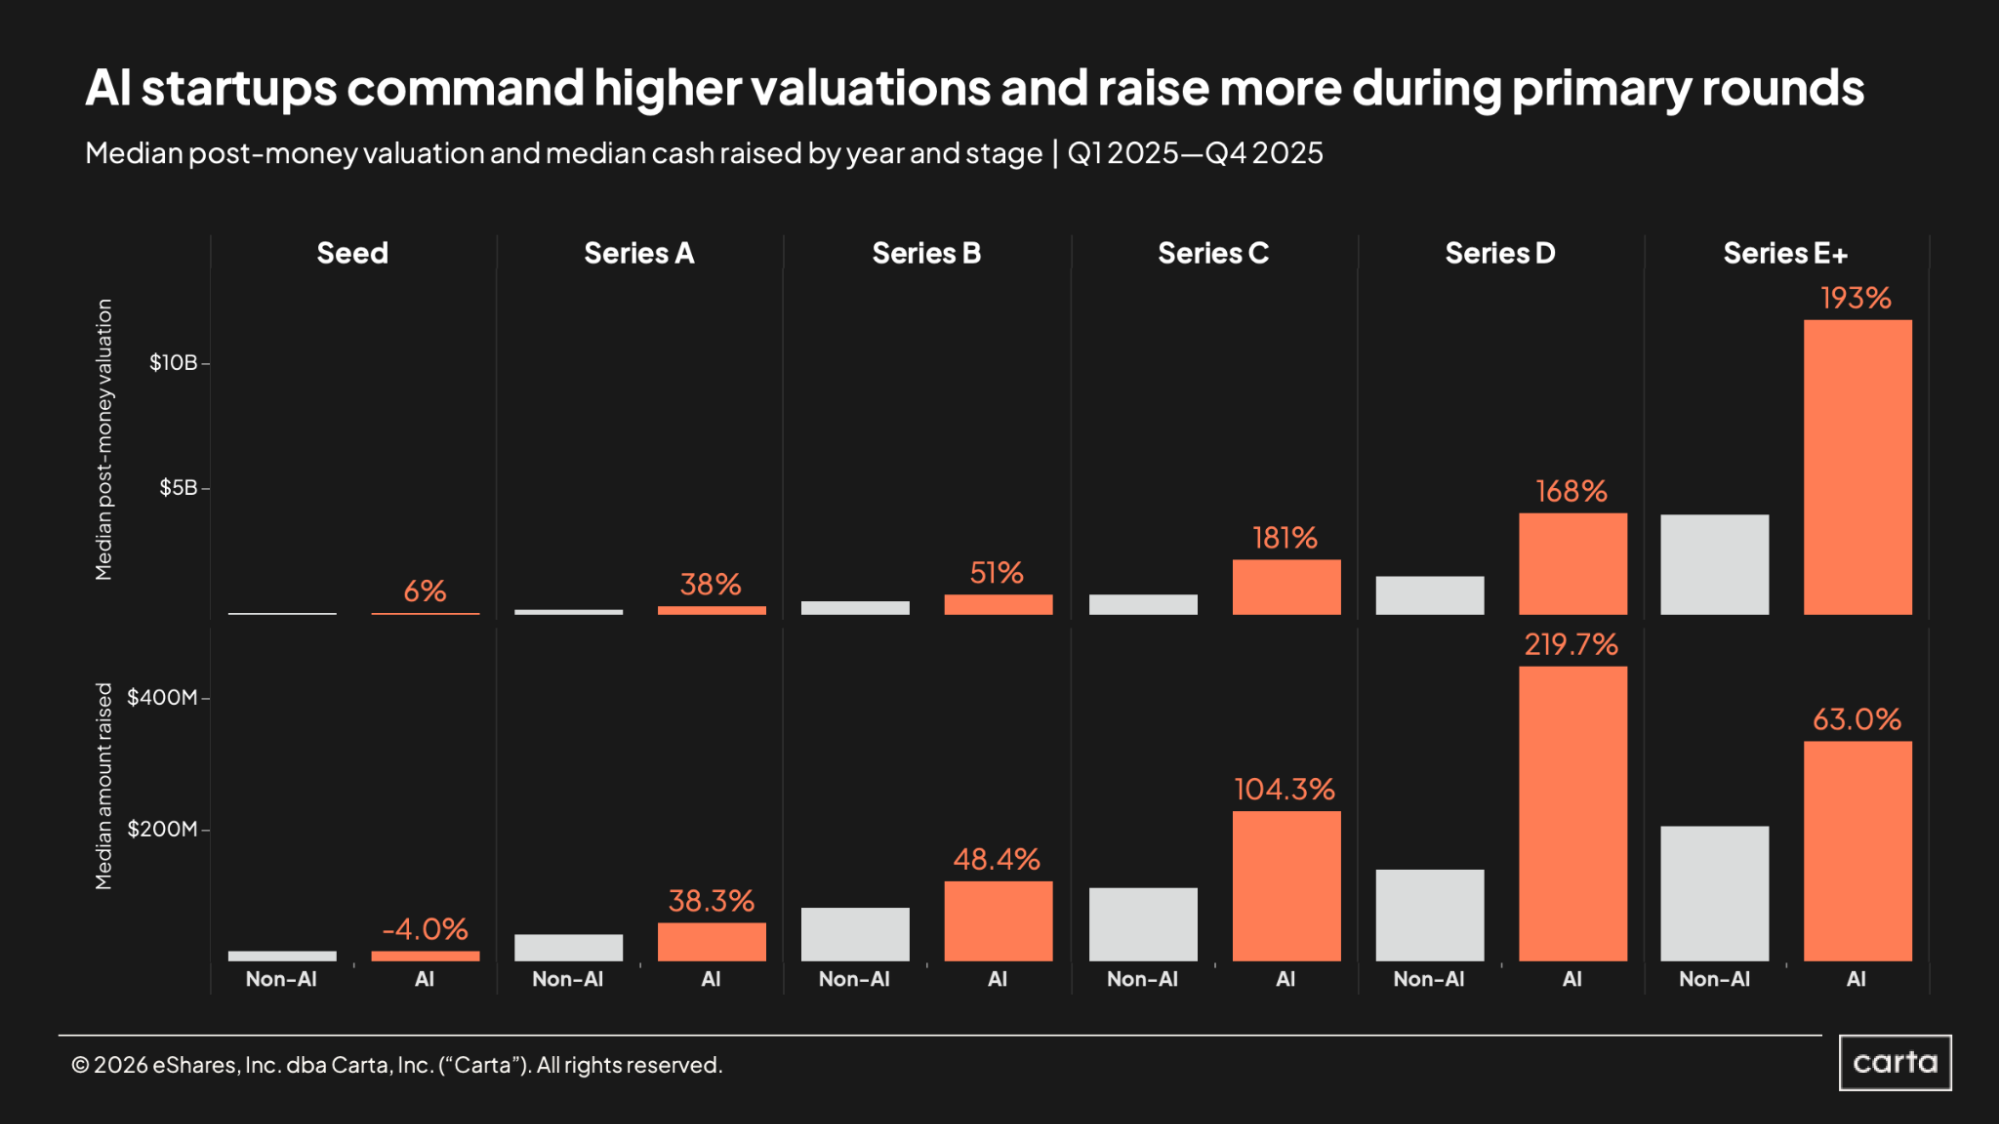
Across every stage, startups in AI tend to command higher post-money valuations and raise larger sums of money than non-AI startups. To some degree, this is likely due to the higher capital needs of AI startups in certain areas, such as those designing chips or building and training bespoke models. To another degree, it’s also due to investor enthusiasm, with VCs willing to deploy large sums of money at lofty prices in pursuit of startups that might be able to generate truly exponential returns.
This tendency is less pronounced at the early stages and grows more so at later ones. At seed, for instance, the median AI startup actually raises 4% less cash than the median non-AI startup, while median valuations are just 6% higher in AI. At Series E+, on the other hand, the difference is huge: There, the median AI startup raises 63% more cash and attains a valuation that’s 193% higher than the median non-AI startup.
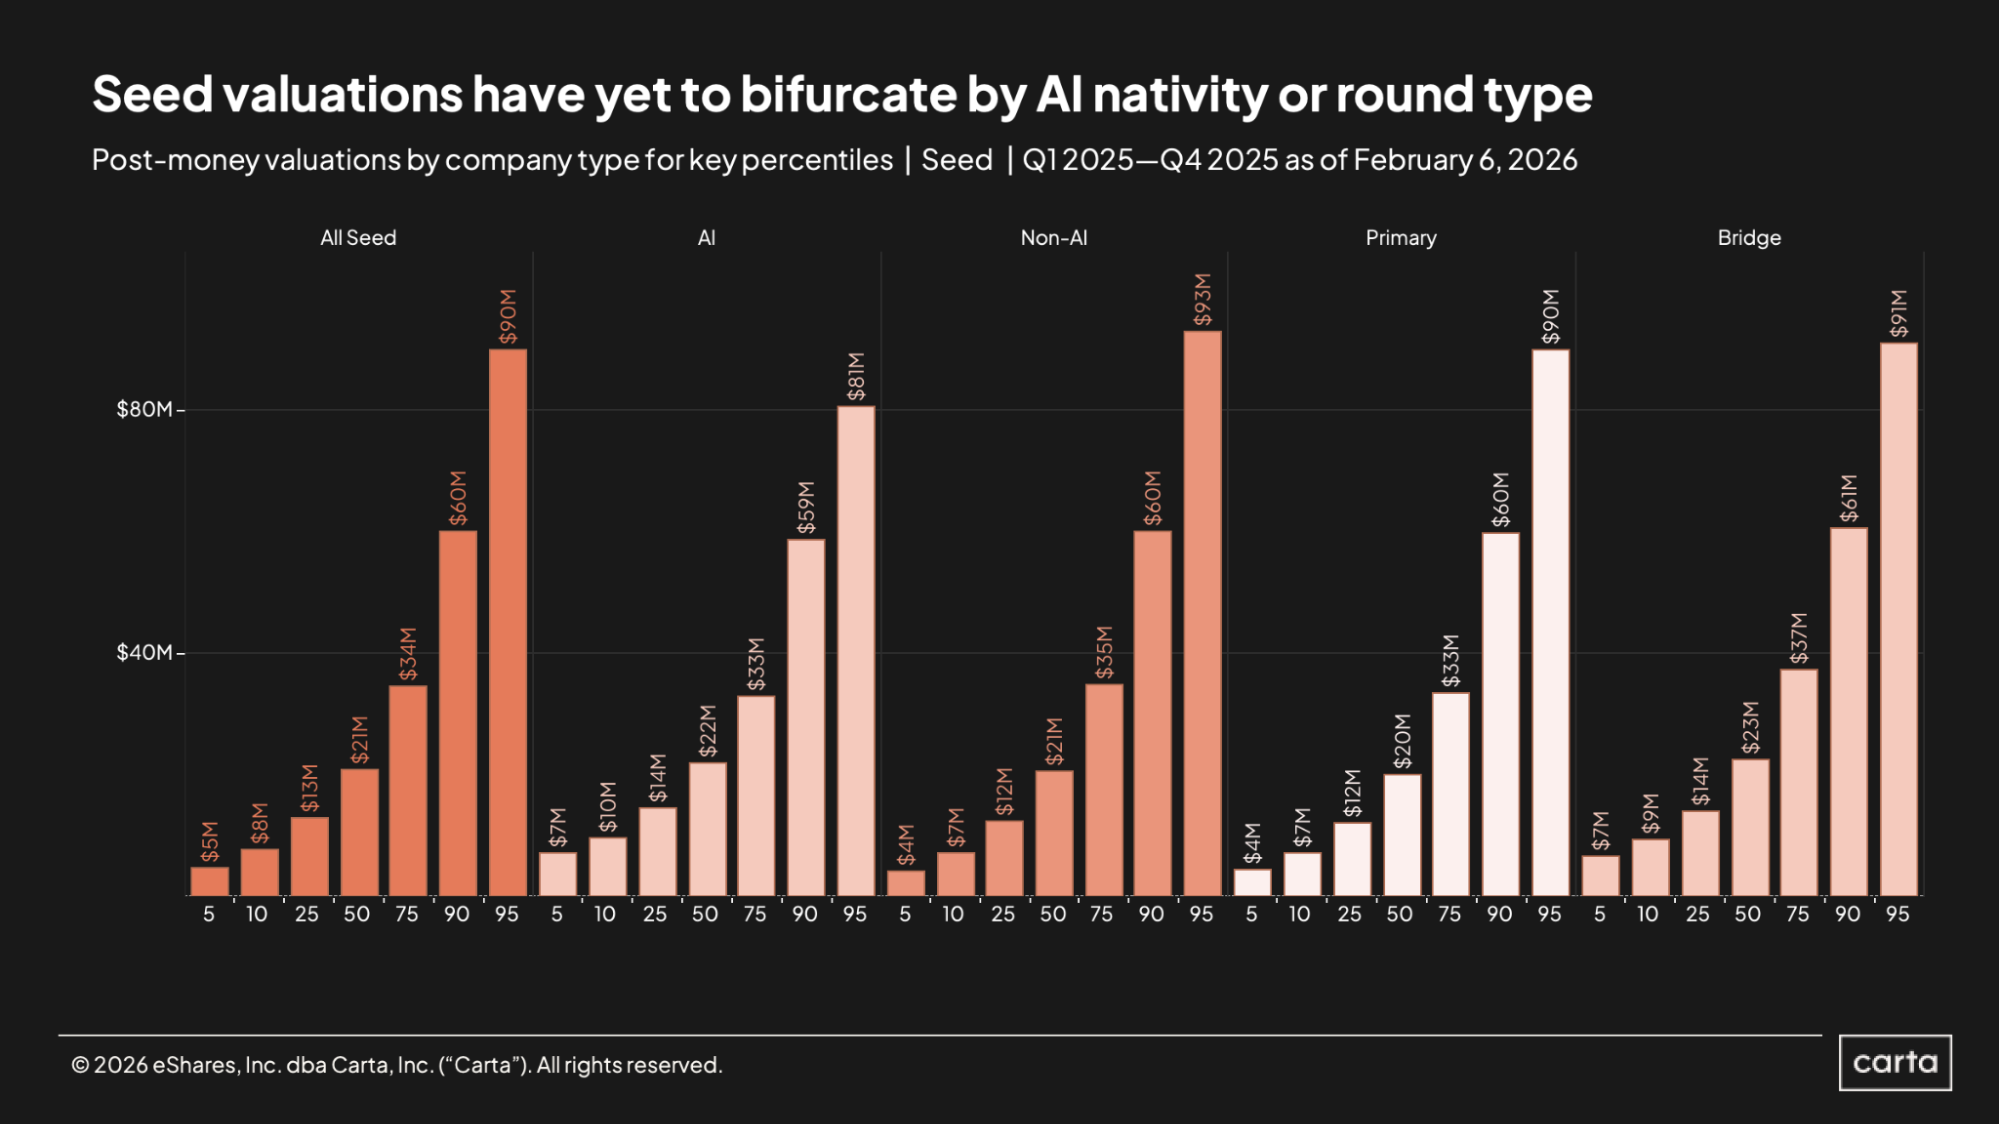
Regardless of whether it’s a primary round or a bridge round and whether the company raising the round is in the AI space or not, post-money valuations at the seed stage tend to look roughly similar. Across all total seed rounds raised on Carta in 2025, the median valuation was $21 million. For AI startups, the median was $22 million, and for non-AI startups, it was $21 million. On primary rounds, the median was $20 million, and on bridge rounds, it ticked up to $23 million.
The trend holds at other statistical thresholds as well. For instance, the 90th percentile for post-money seed valuations in AI was $59 million last year, compared to $60 million for non-AI. And the 90th percentile was $60 million on primary rounds versus $61 million on bridge financings.
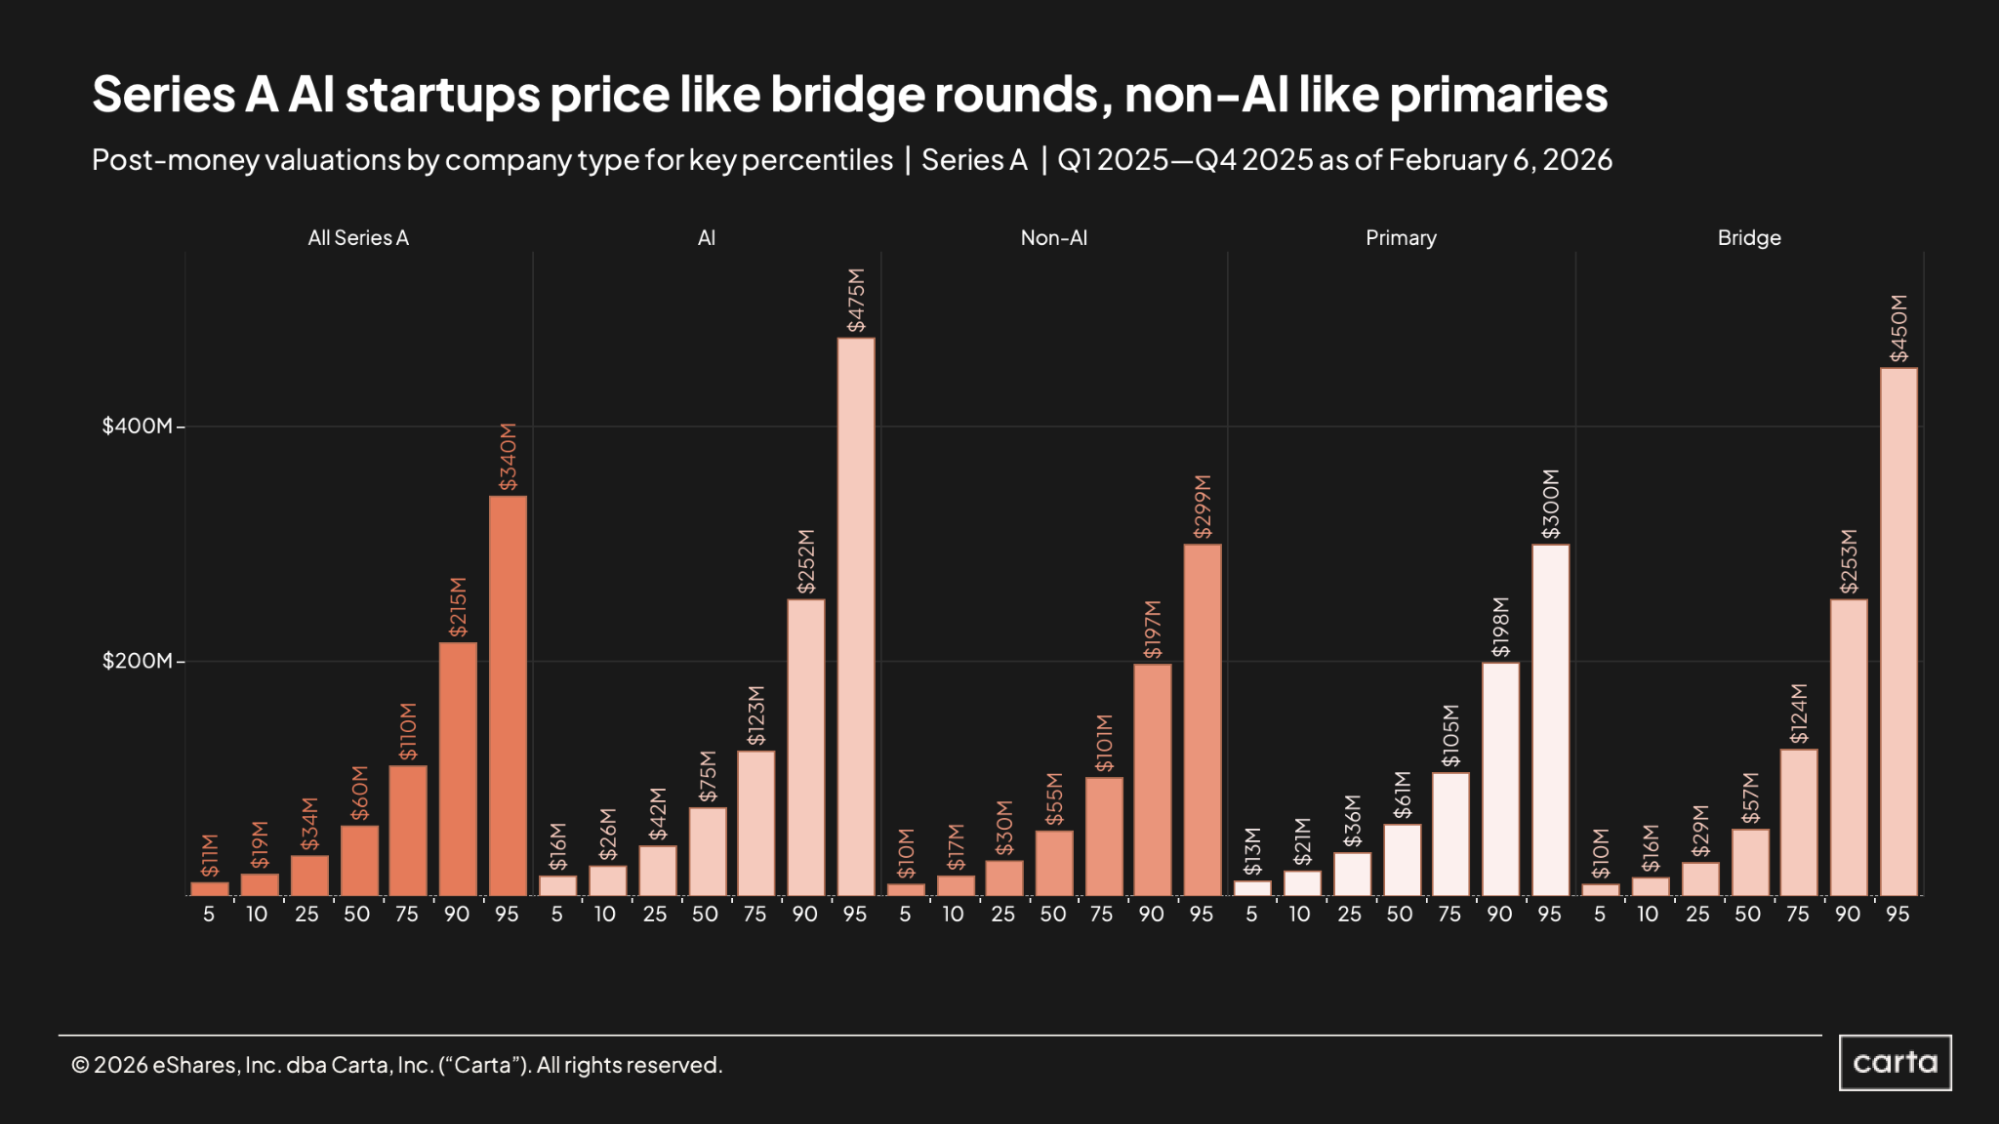
The median post-money Series A valuation last year across all funding types was $60 million. For AI startups, the median was 25% higher, landing at $75 million; for non-AI startups, the median was a touch lower, at $55 million. AI startups achieved higher post-money valuations than non-AI startups at every statistical threshold shown here.
At the lower end of the market—namely, from the 5th percentile through the 50th percentile—startups raising primary Series A rounds attained higher valuations than Series A startups raising bridge funding. But this trend reversed at higher statistical thresholds, where bridge valuations were larger. The 95th percentile for Series A bridge valuations was $450 million in 2025, compared to $300 million for primary rounds.
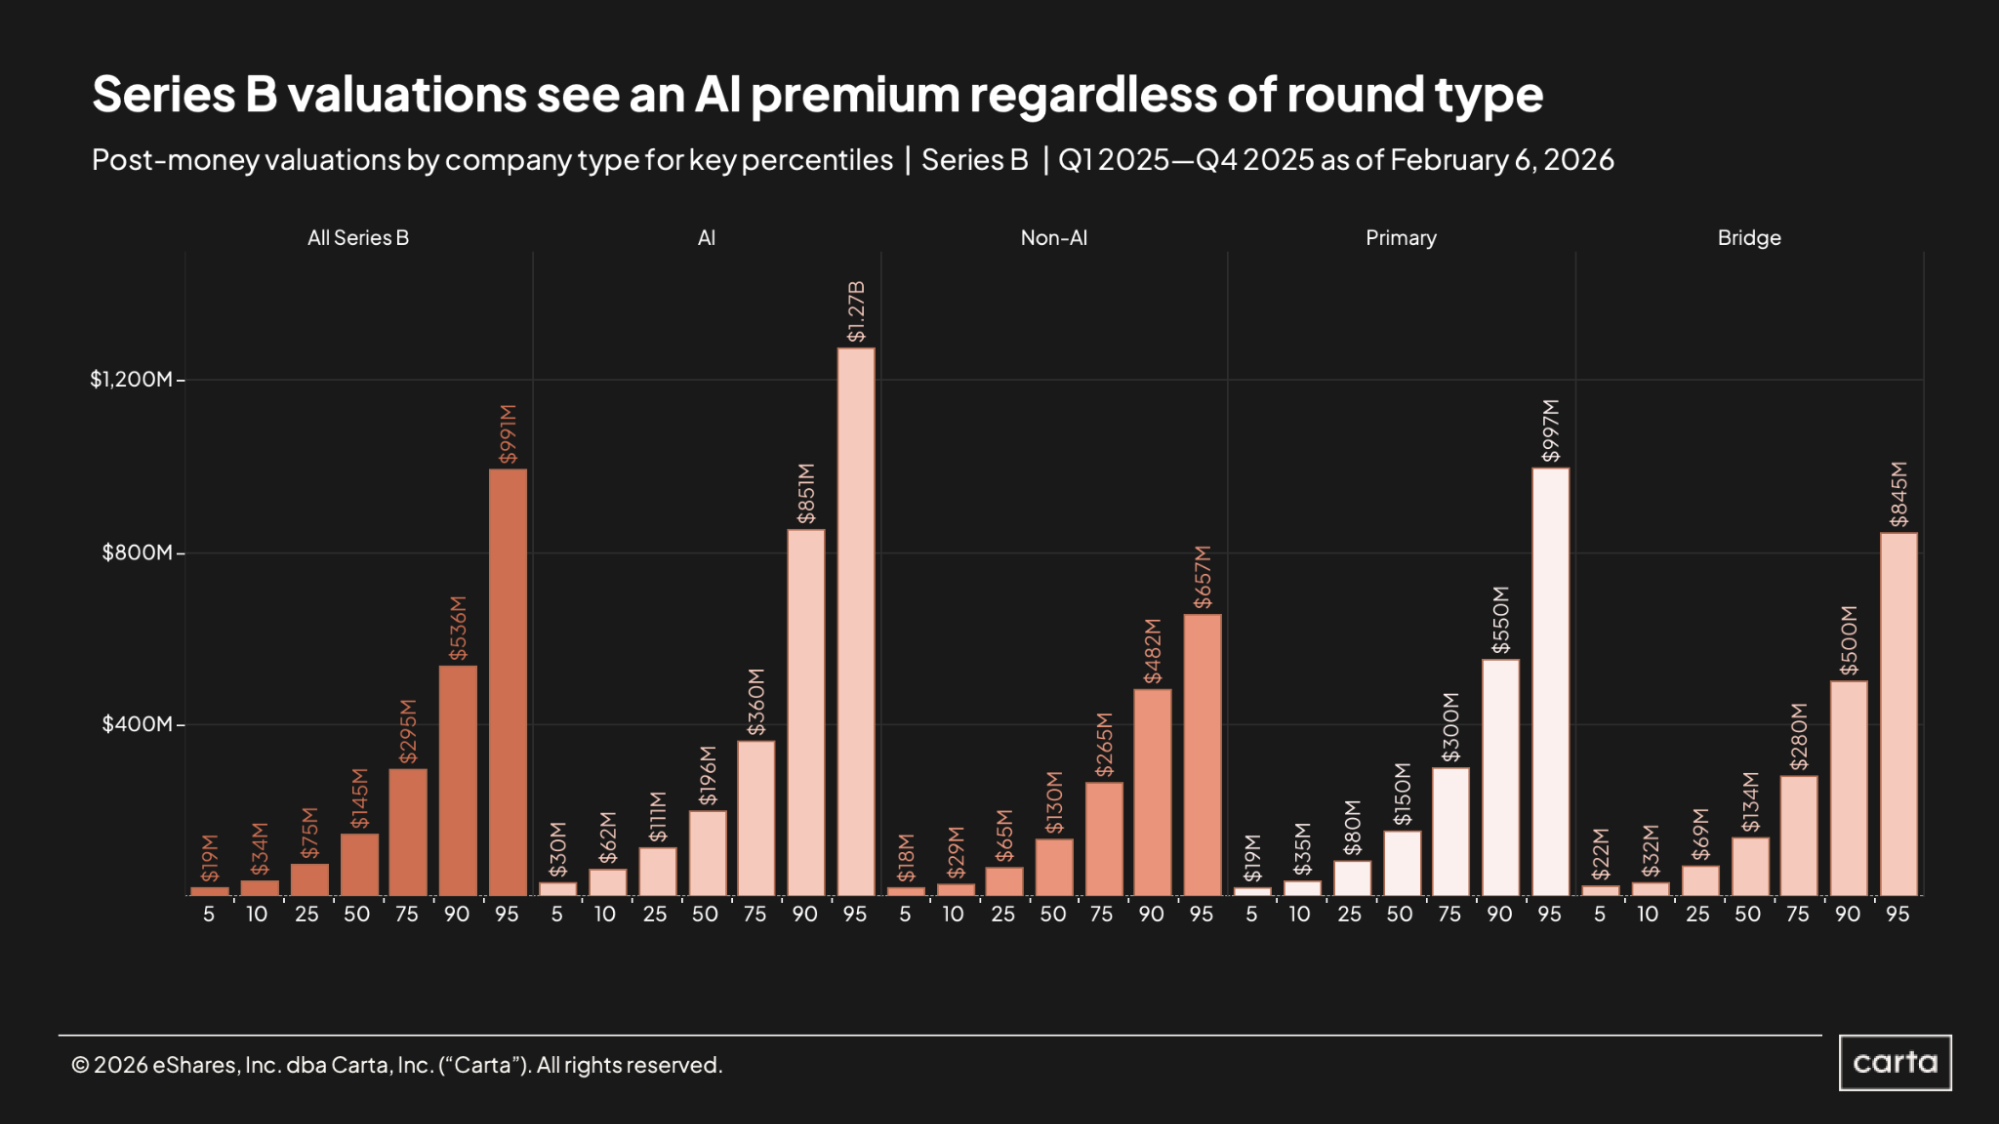
The valuation gap between AI startups and non-AI startups on Carta was even higher last year at Series B than it was at Series A. The median Series B post-money valuation in the AI space landed at $196 million, 51% higher than the median Series B valuation for non-AI startups, which was $130 million.
Across all Series B deals last year, the median Series B post-money valuation was $145 million. At the top of the market, though, some Series B valuations ended up significantly higher. The 75th percentile for Series B post-money valuations was $295 million in 2025, while the 95th percentile was $991 million.
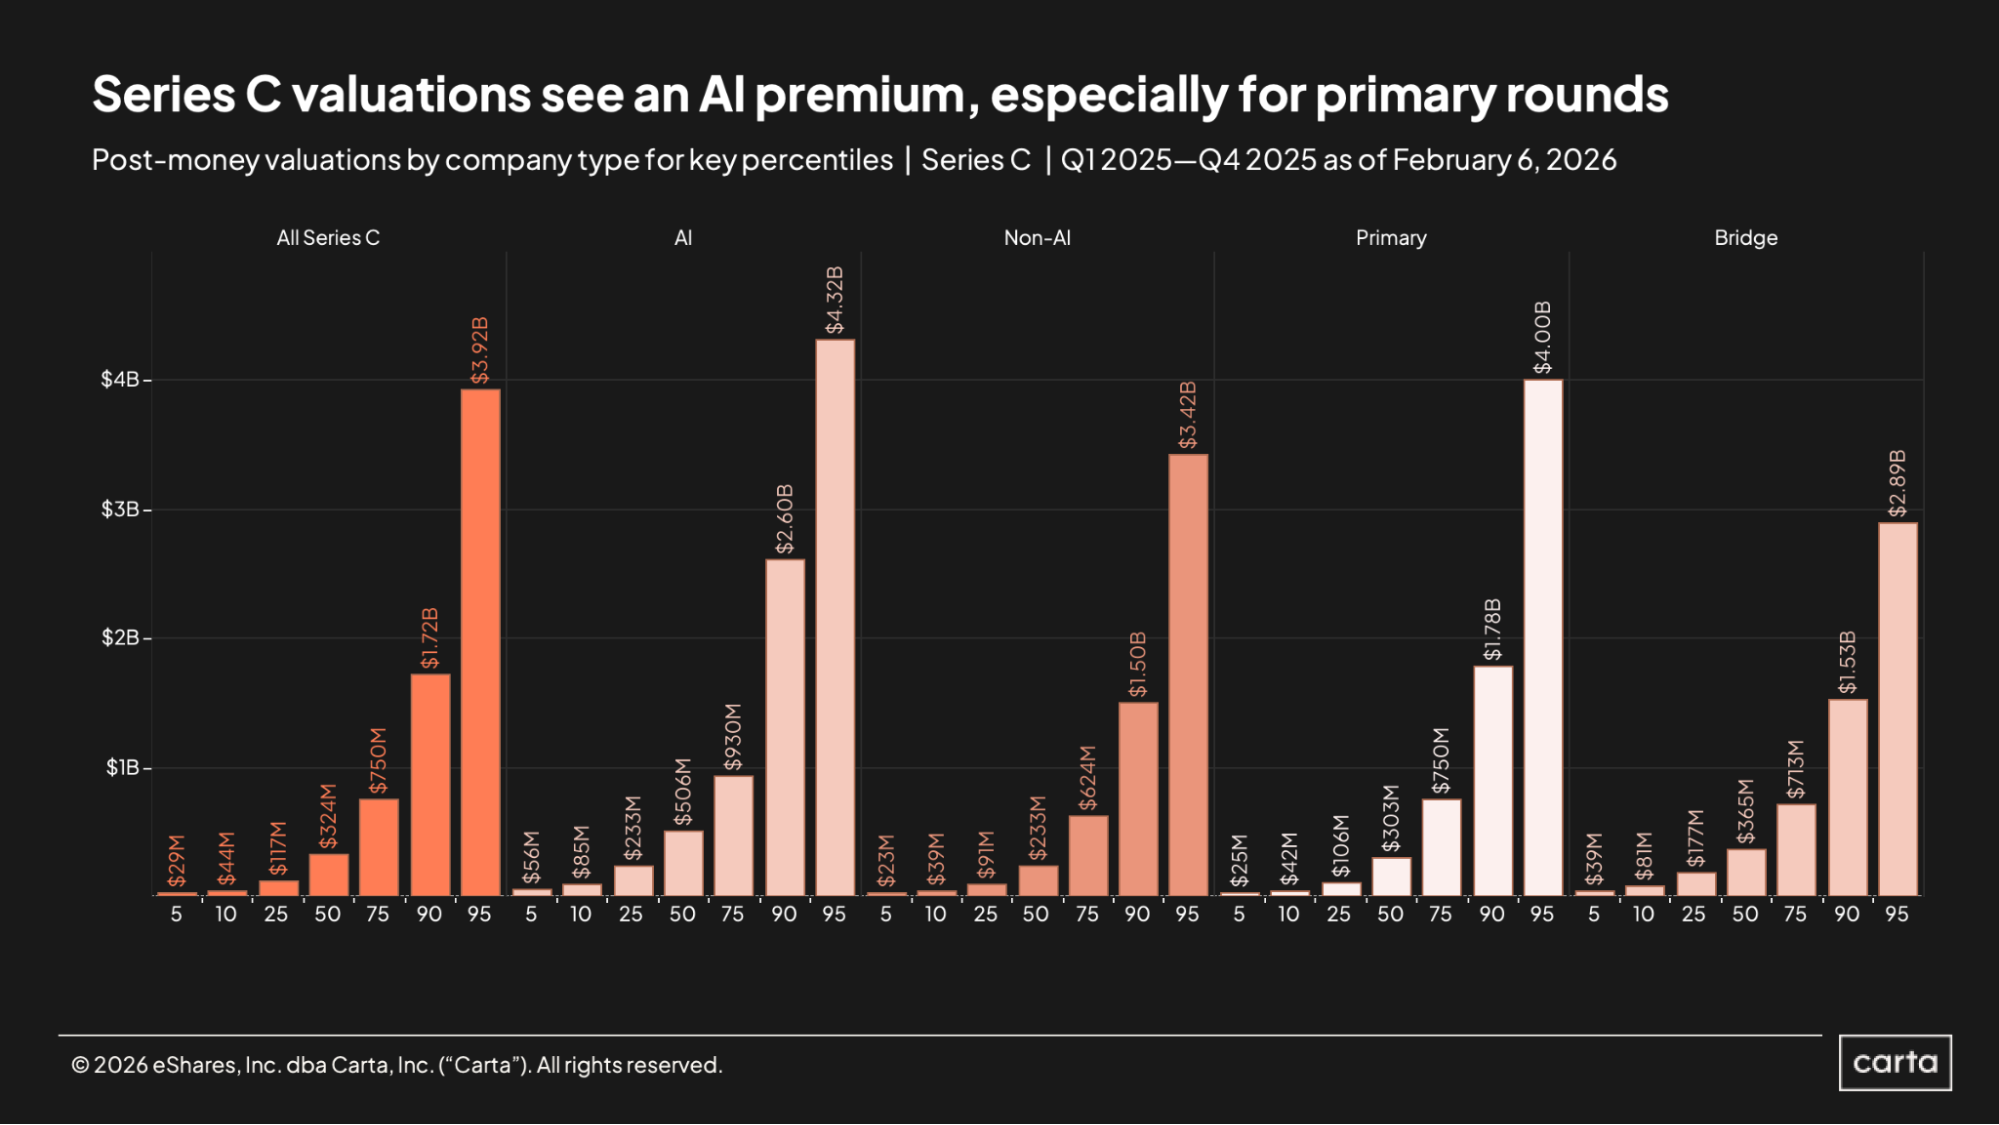
At Series C, the median post-money valuation in Carta checked in at $324 million in 2025. Among AI startups, the median valuation was significantly higher, reaching $506 million. Among non-AI startups, it was significantly lower, at $233 million. In other words, the typical AI startup at Series C was valued more than twice as high as the typical non-AI startup last year.
For primary funding rounds, the median post-money Series C valuation last year was $303 million, compared to a median valuation of $365 million for Series C bridge rounds. At the very top end of the market, though, primary valuations easily outstrip bridge valuations: The 95th percentile valuation for primary Series C rounds was $4 billion last year, compared to $2.89 billion for the 95th percentile of bridge rounds at Series C.
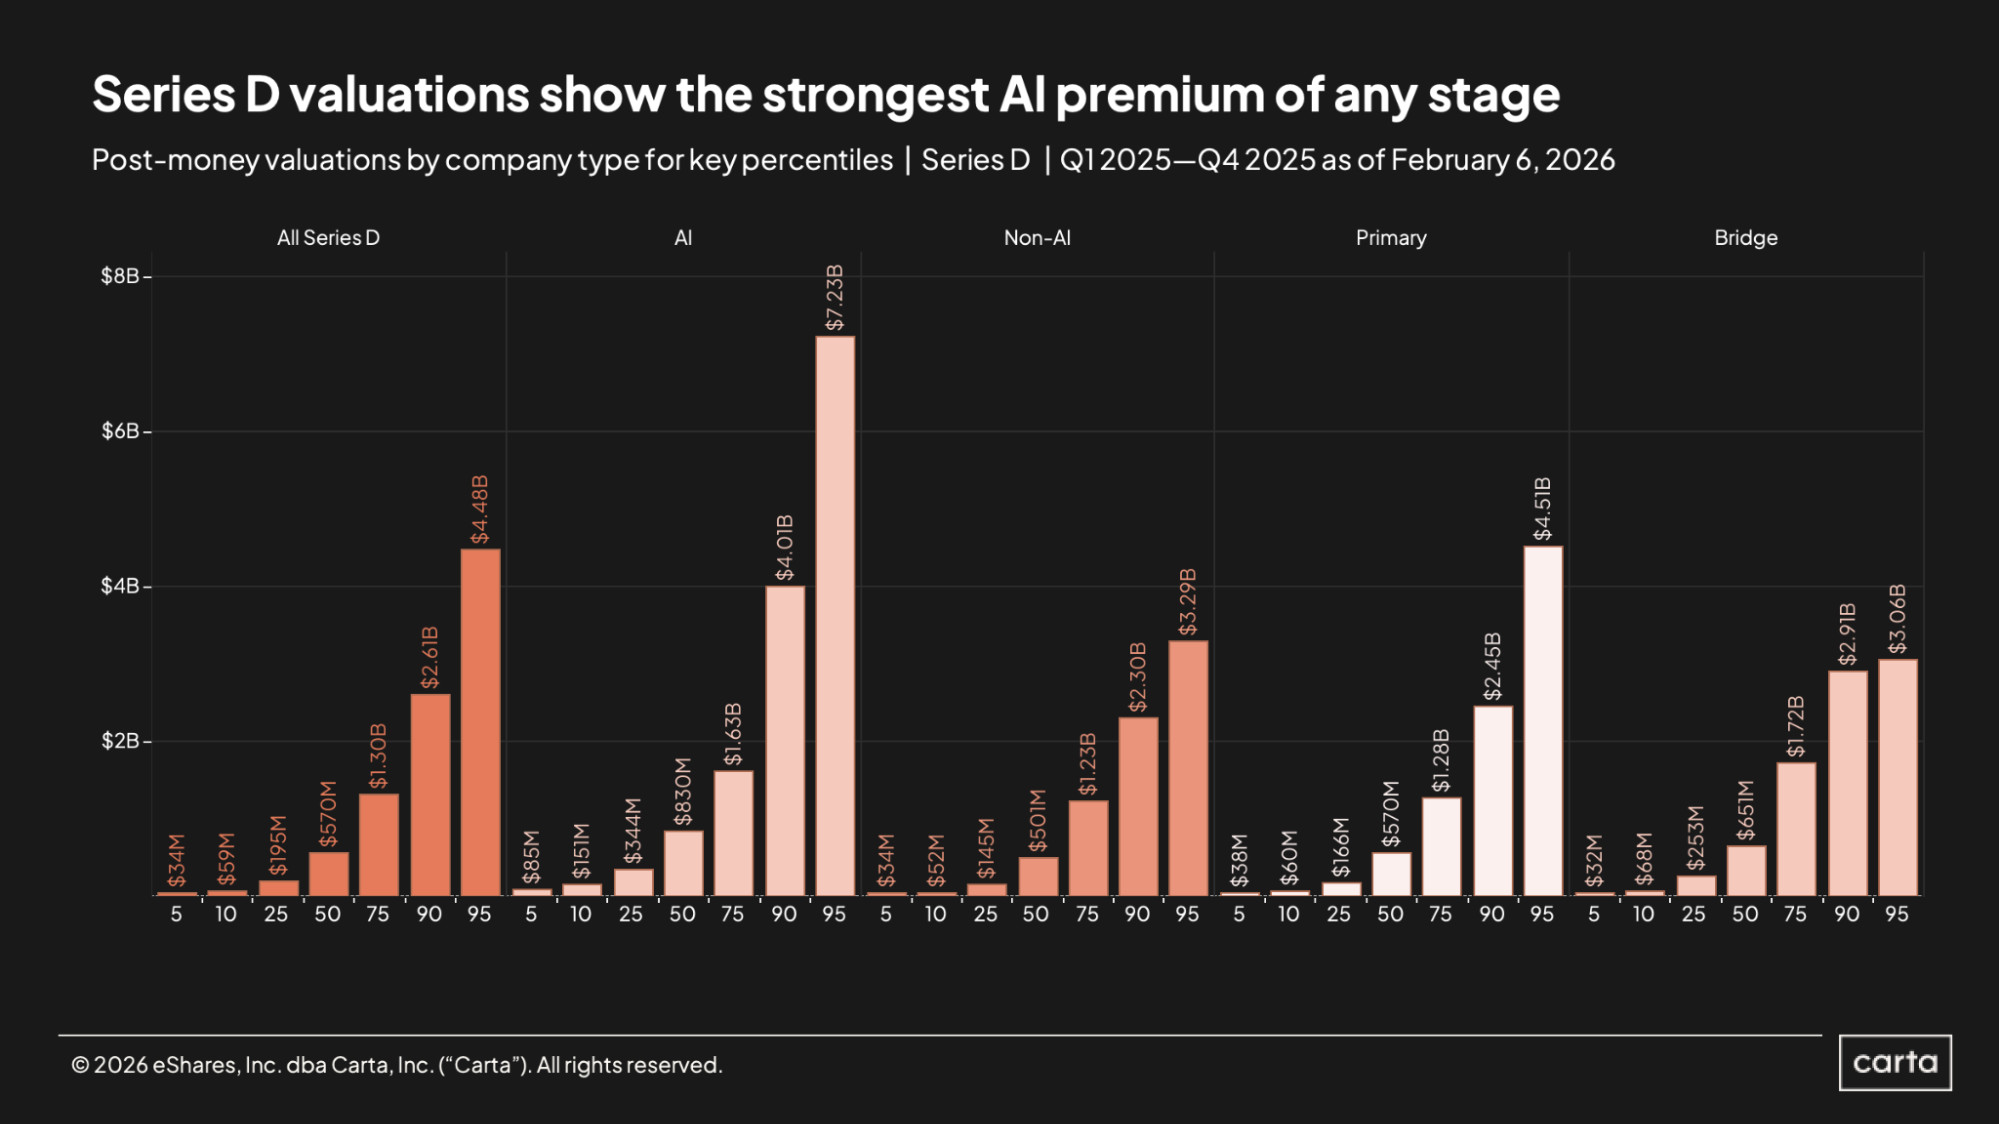
In terms of post-money valuations, AI startups at Series D were playing a completely different game than non-AI startups in 2025. The median Series D valuation in the AI space on Carta was $830 million last year, 66% higher than the median Series D valuation of $501 million for non-AI startups. At the 95th percentile, the gap widens further. In the AI space, the 95th percentile Series D valuation was $7.23 billion, more than twice as high as the 95th percentile valuation for non-AI Series D rounds.
Across all sectors and all round types, the median Series D post-money valuation on Carta was $570 million last year. That’s exactly the same as the median Series D valuation on primary rounds, but a touch lower than thea median valuation of $651 million for Series D bridge rounds.
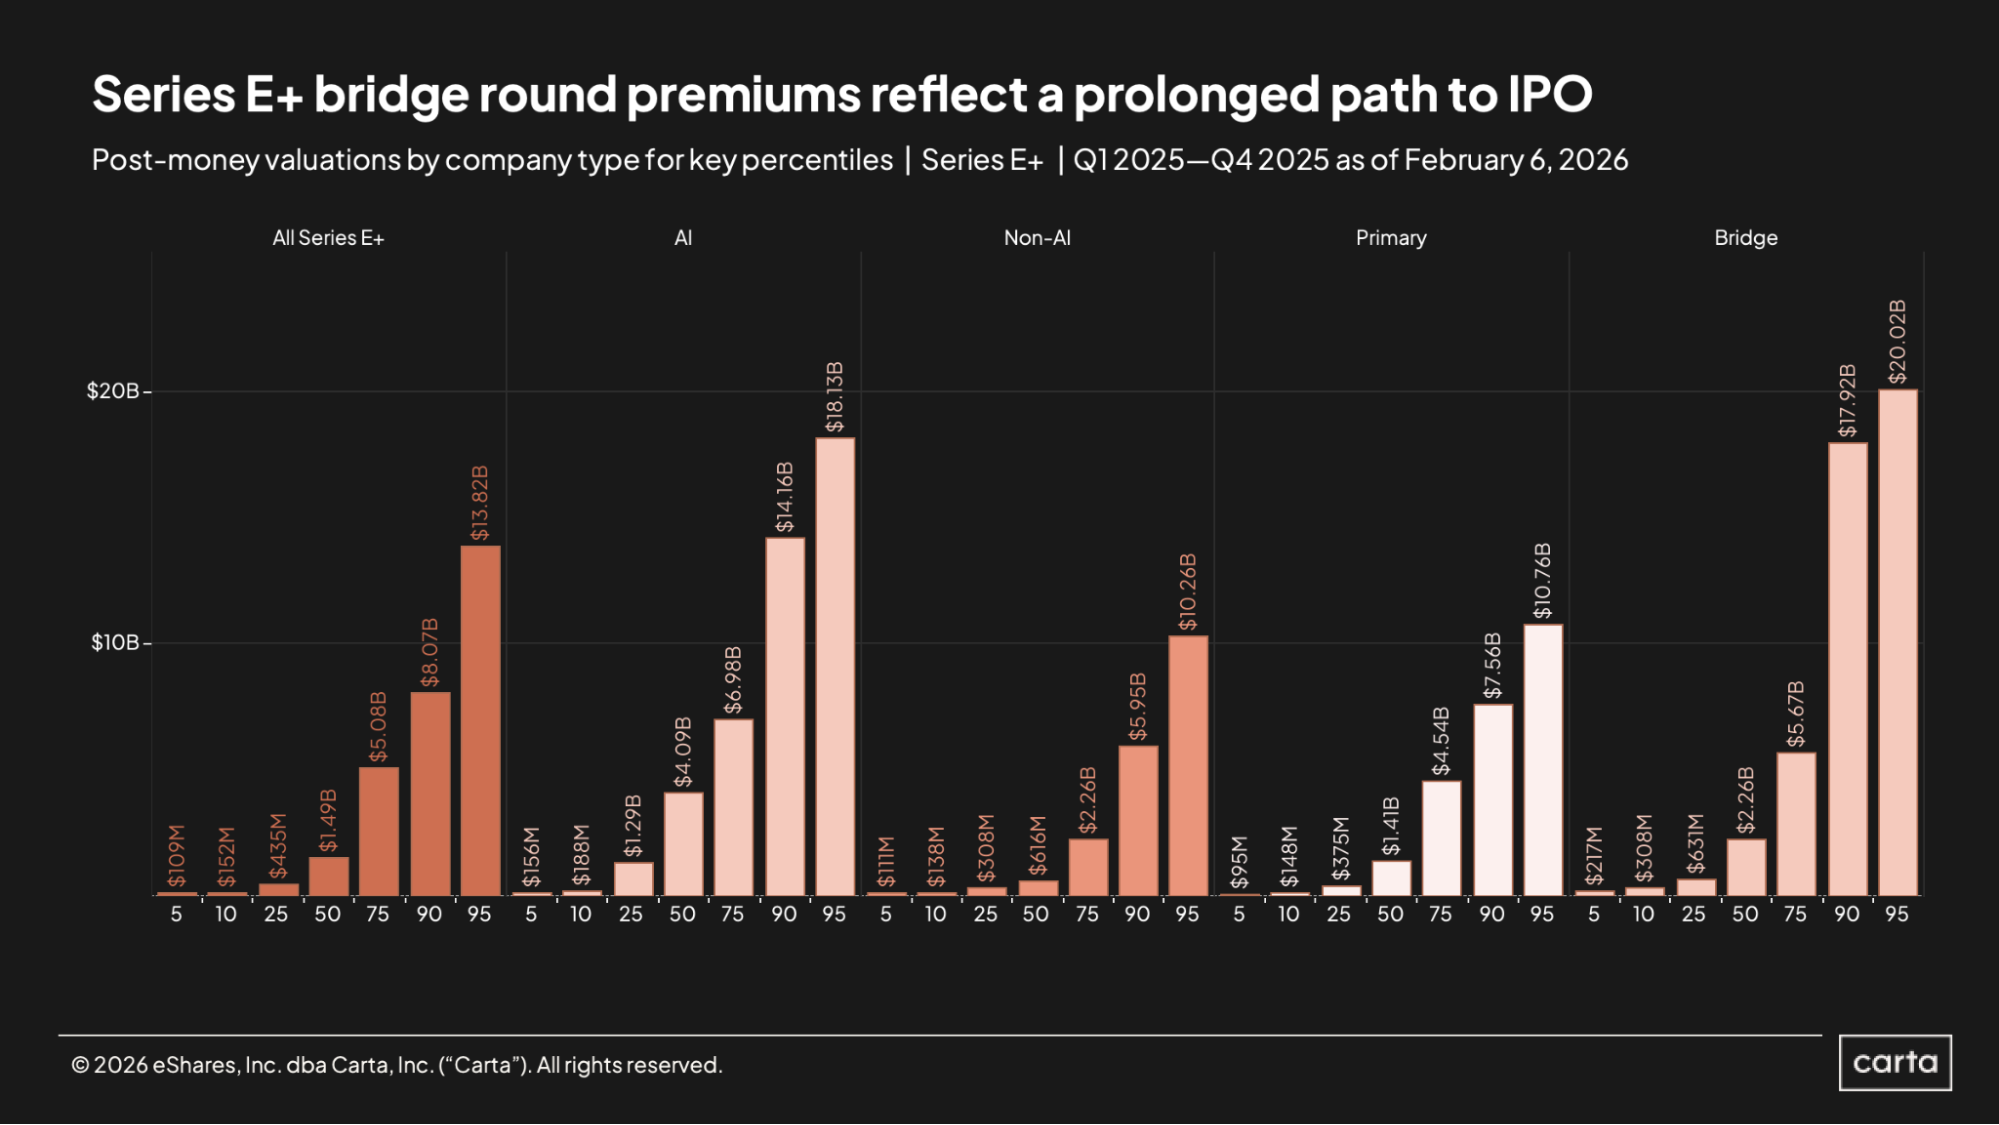
Among the most mature startups in the market—those at Series E and beyond—bridge valuations were significantly higher on Carta last year than primary valuations. The median post-money bridge valuation landed at $2.26 billion, compared to $1.41 billion for primary rounds and $1.49 billion across all funding rounds combined. And the 95th percentile for bridge valuations soared all the way to $20 billion in 2025, compared to a 95th percentile of $10.7 billion on primary rounds.
Once again, AI startups at this stage were able to achieve notably higher valuations than their non-AI peers. The median post-money valuation for AI companies at Series E+ was $4.09 billion last year, versus a median valuation of $616 million for non-AI startups.
Industry trends
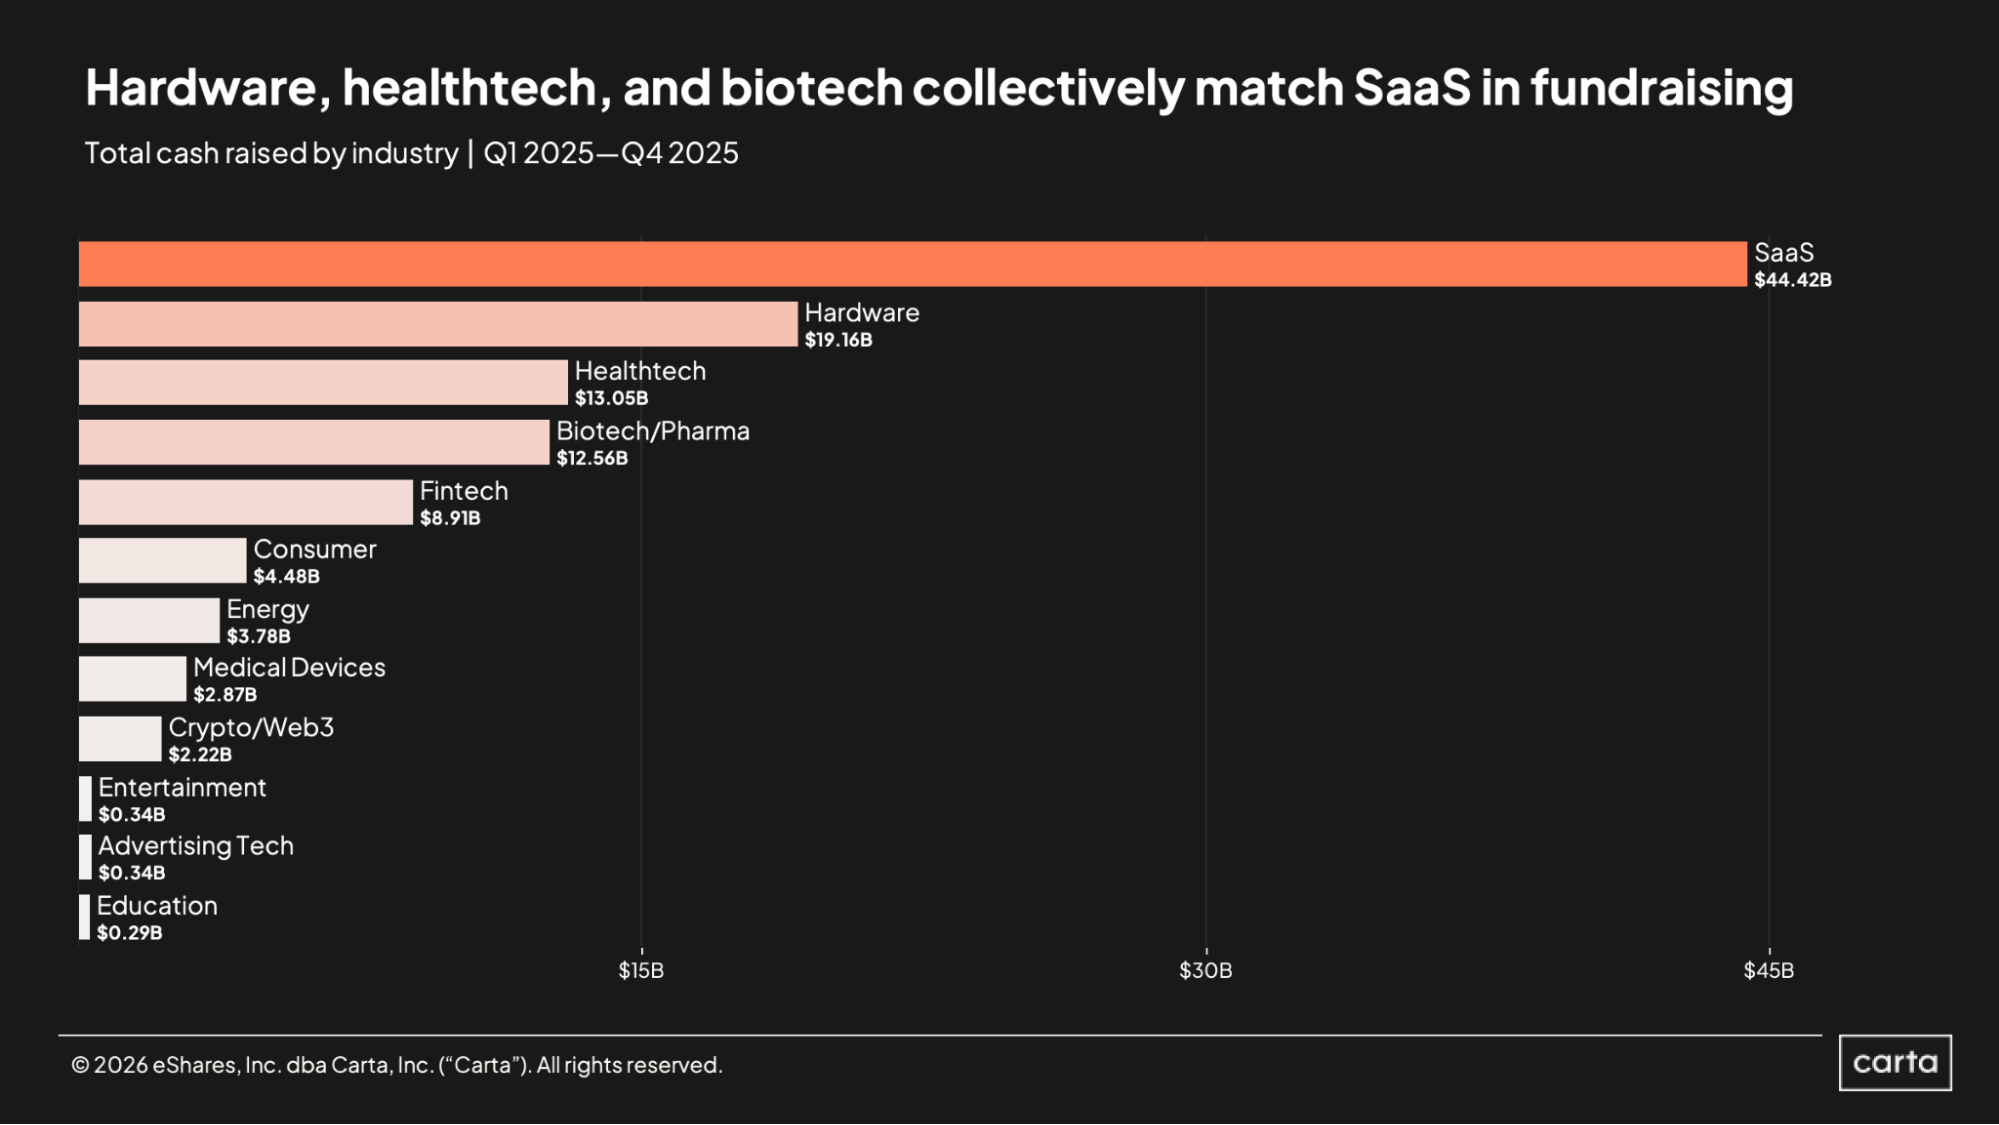
SaaS startups on Carta combined to bring in more than $44.4 billion in total funding over the course of 2025, easily the most of any major startup industry (not counting AI, which spans across many of the industries shown in the above chart). In fact, the SaaS space was responsible for nearly as much fundraising as the next three busiest sectors combined: Hardware, healthtech, and biotech/pharma claimed a combined $44.8 billion in cash raised during 2025.
There’s a clear line of demarcation between the top eight industries shown here and the last three. Startups in crypto/Web3, ranked eighth on the list, totaled $2.2 billion in new funding last year, which was 6.5x greater than the fundraising totals in entertainment and advertising tech. Entertainment, adtech, and education were essentially niche sectors last year, each with less than $350 million in overall cash raised.
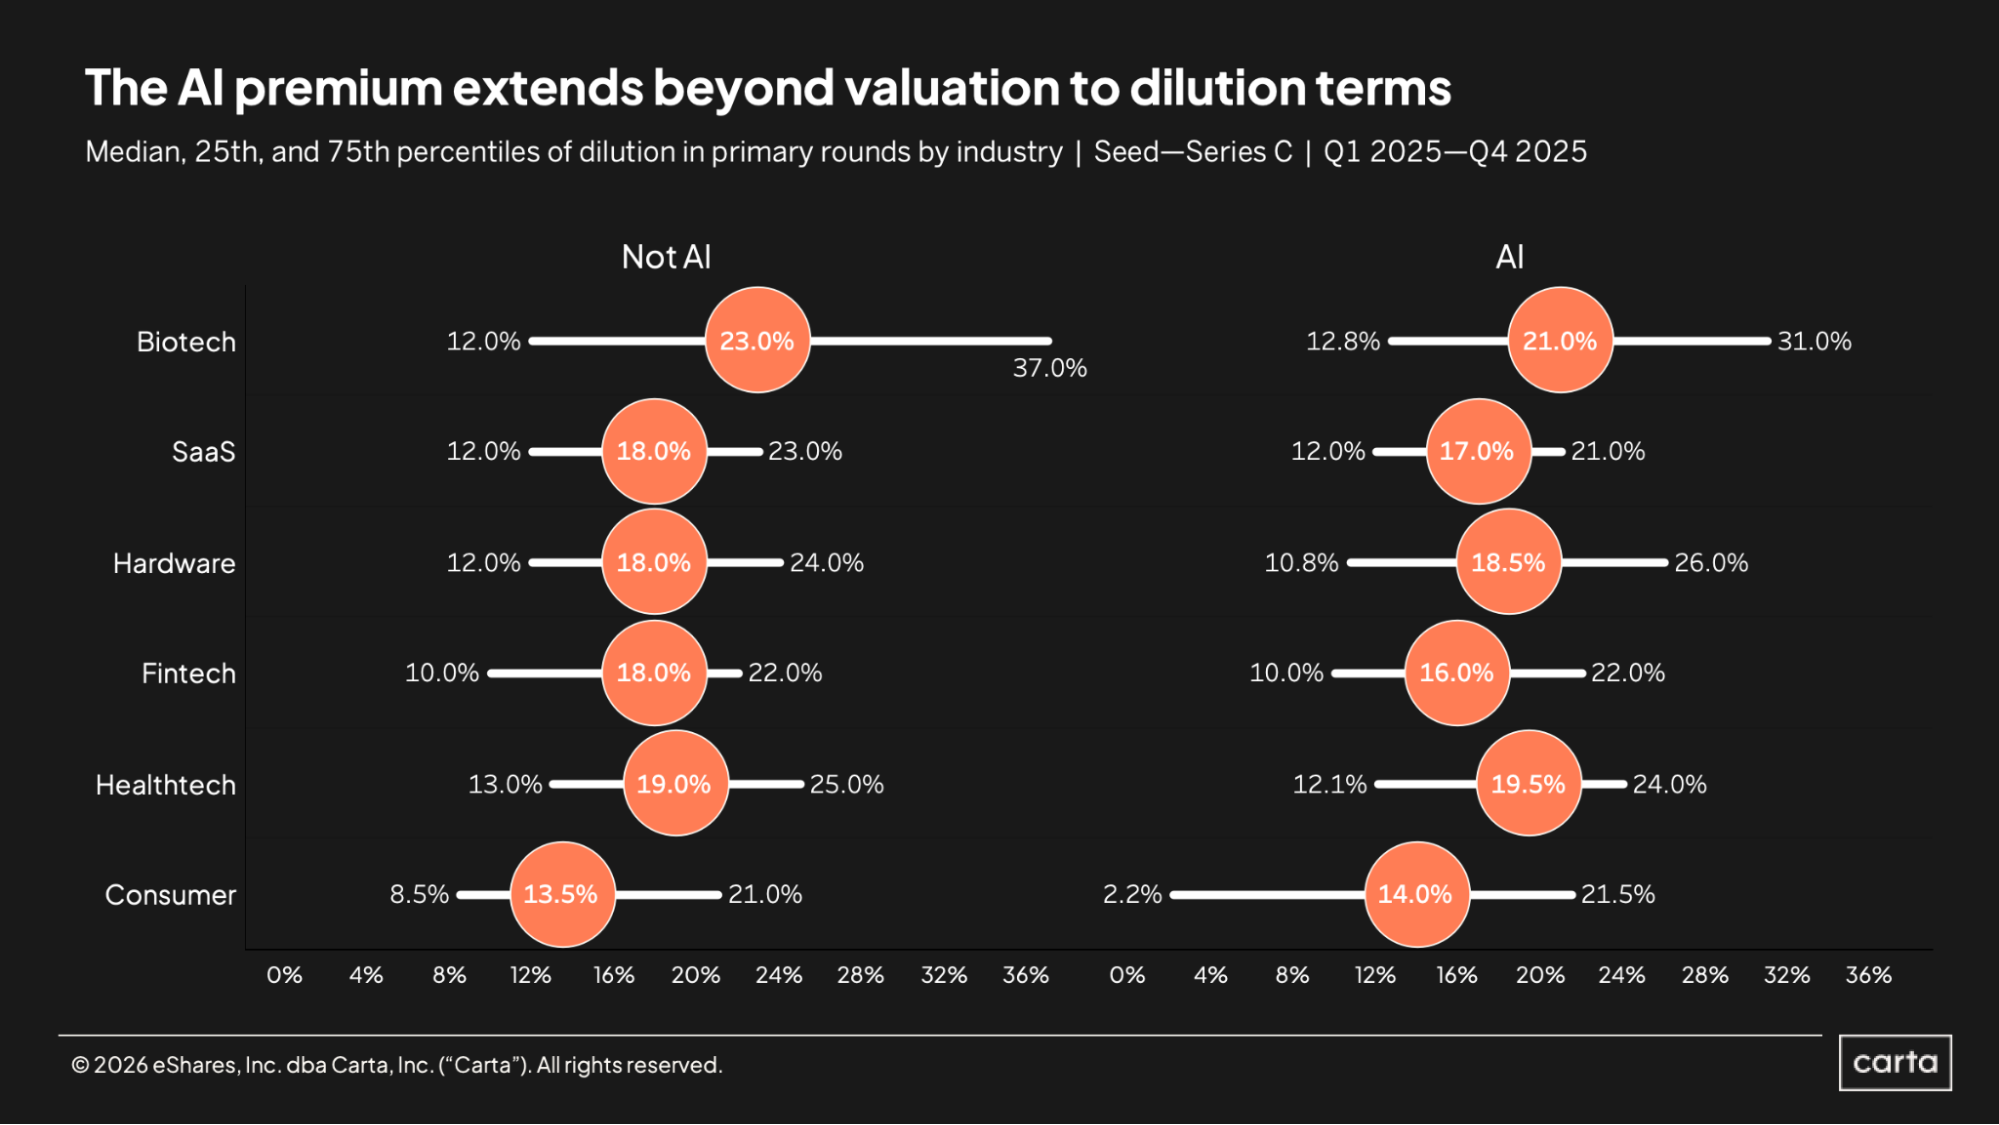
In the biotech, SaaS, and fintech sectors, median dilution on new funding rounds last year between the seed stage and Series C was lower for AI startups than for non-AI startups. In the hardware, healthtech, and consumer sectors, on the other hand, median dilution was higher in AI. In the SaaS space—the largest industry for VC fundraising—median dilution was 17% for AI companies and 18% for companies not in AI.
At the 25th percentile, dilution is lower among AI startups in every industry shown here except for biotech. This may reflect that upper-quartile startups in AI often are in a better bargaining position with potential VC investors than their non-AI counterparts, with that leverage equating to more founder-friendly dilution terms.
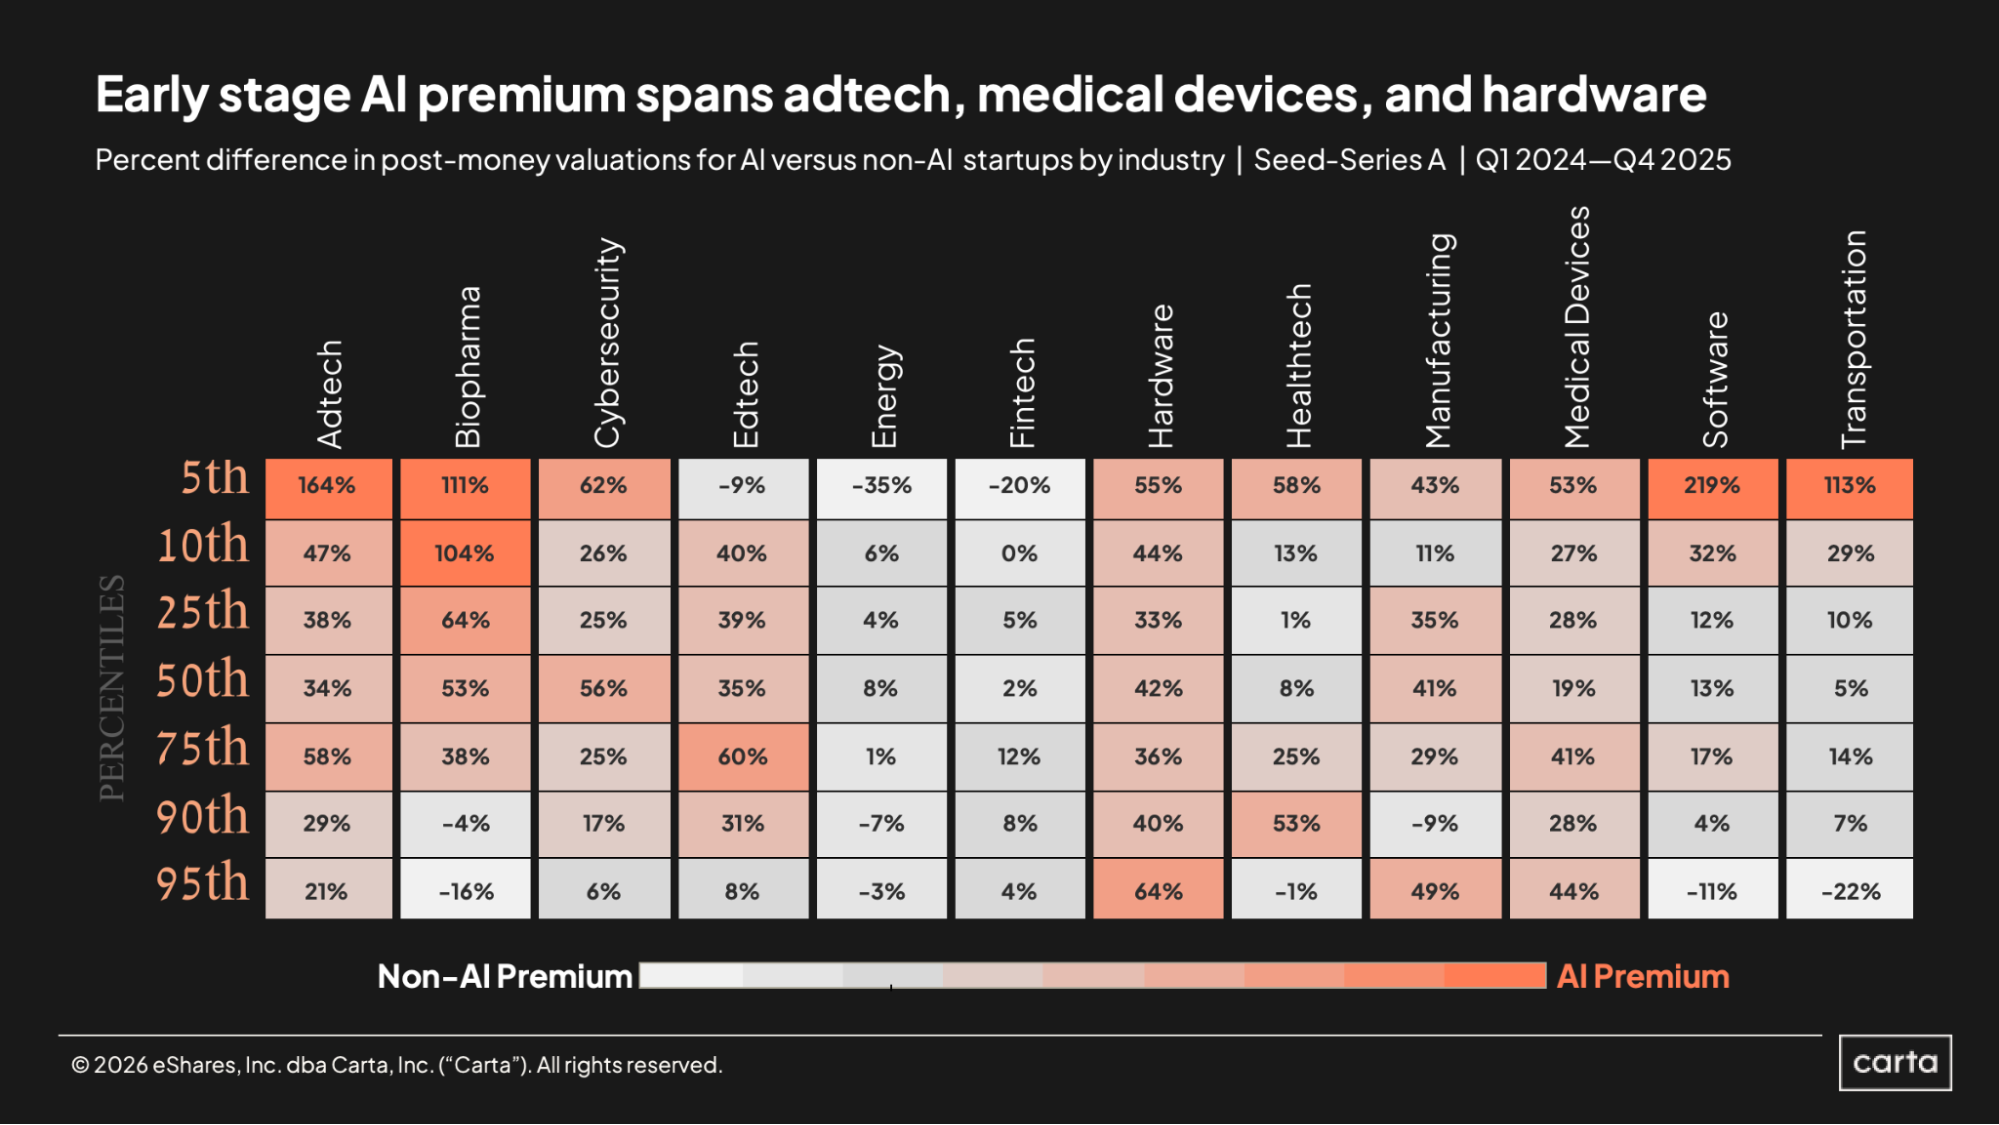
In every industry, AI startups tend to command higher valuations than non-AI startups. The above chart shows just how large this premium tends to be across seed and Series A, broken down by industry and percentile. The column on the far left, for instance, shows that the median post-money valuation for AI startups in the adtech space that raised a new seed or Series A round in either 2024 or 2025 was 34% higher than the median post-money valuation for non-AI startups in adtech that raised a round over that span.
The hardware space has one of the most consistent AI premiums of any sector. At every statistical threshold from the 5th percentile through the 95th percentile, AI companies in hardware received valuations between 33% and 64% higher than non-AI companies.
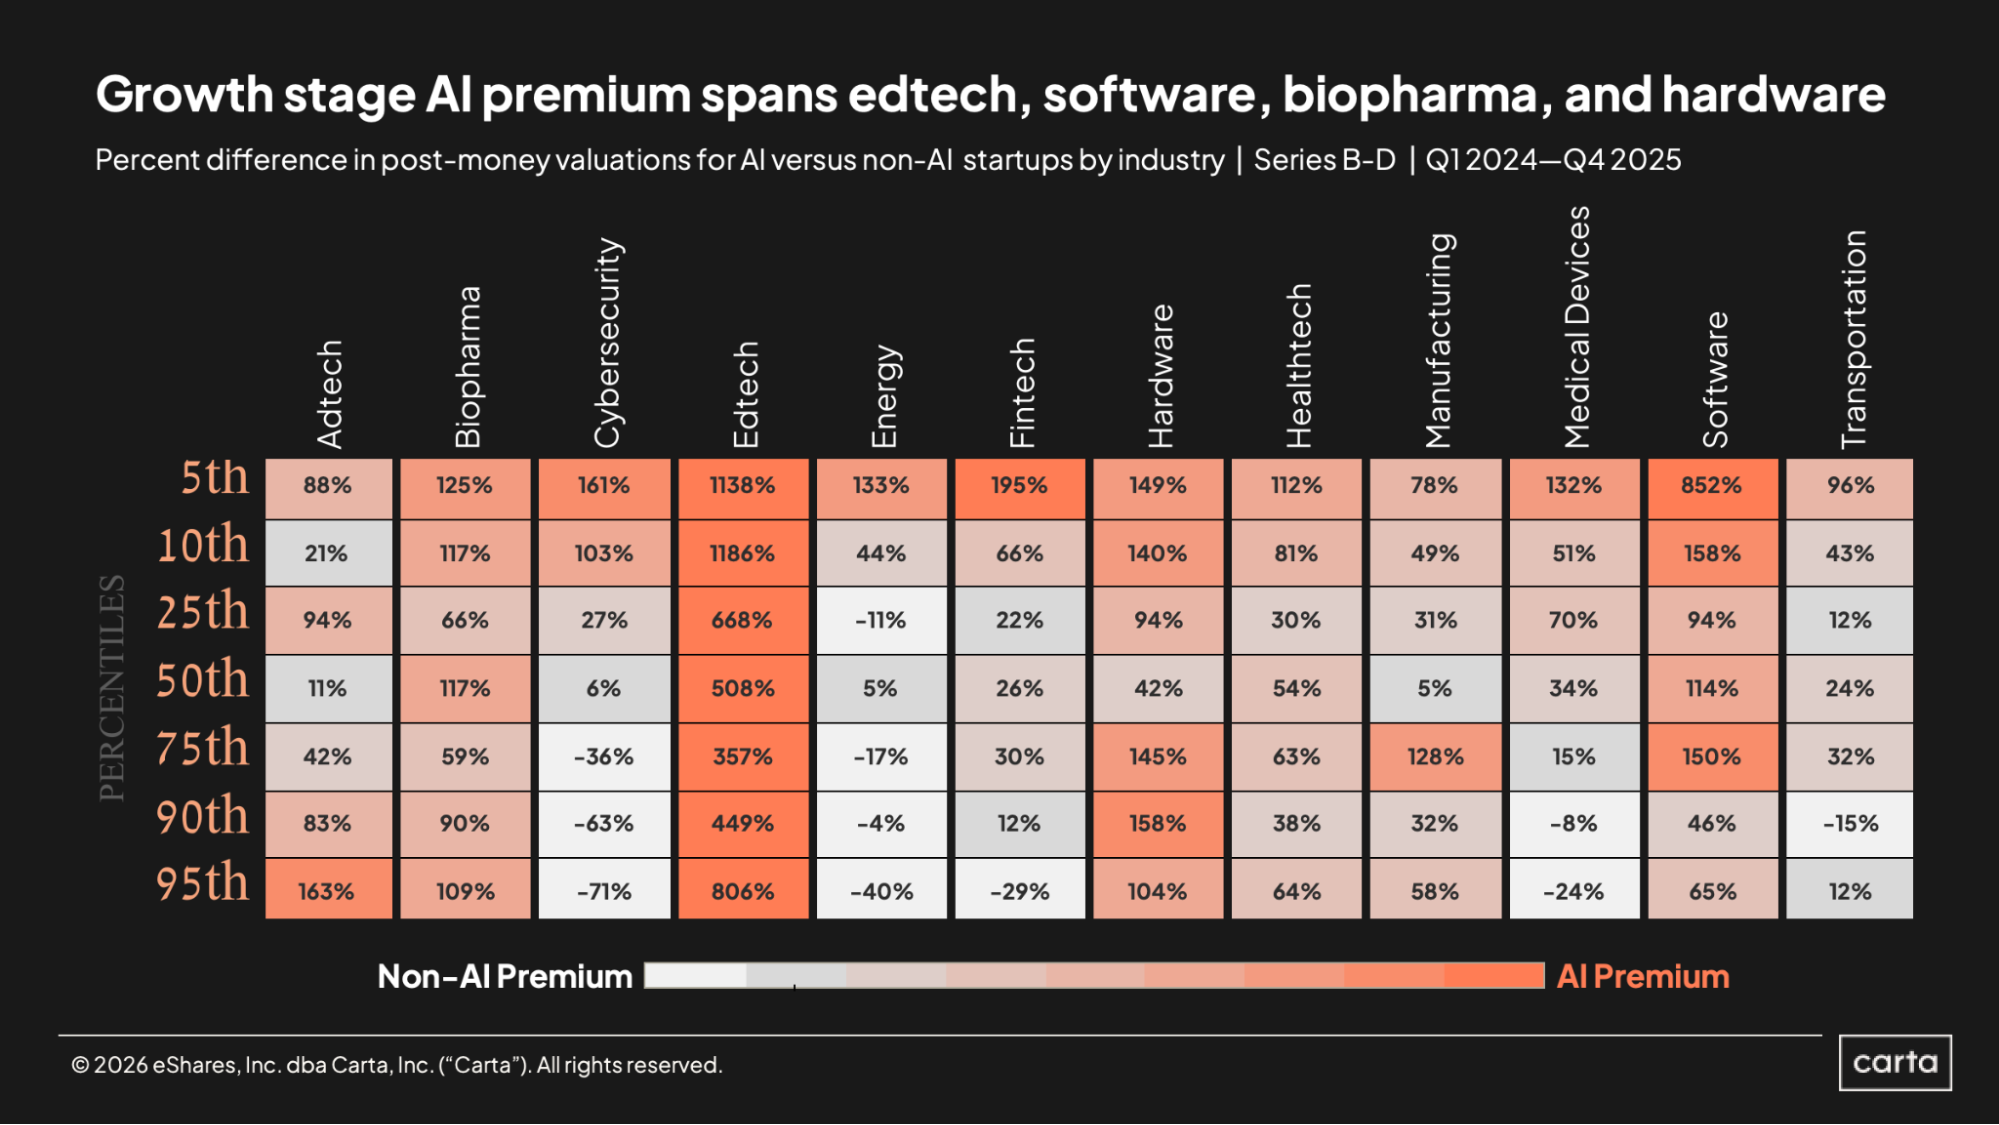
This chart shows the same comparison between post-money valuations at AI startups versus non-AI startups, but at later stages, specifically Series B through Series D. For these rounds, the AI premium tends to be significantly larger. Nowhere is the AI premium higher than in edtech, where AI has shifted from a competitive advantage to a baseline expectation. Conversely, some of the industries with the smallest AI premiums include energy, fintech, and transportation.
In industries such as cybersecurity , and medical devices, the AI premium gets less significant at these stages as valuations rise. In medical devices, for instance, a 5th percentile valuation for AI startups is 132% higher than a 5th percentile valuation for non-AI startups. But at the 95th percentile, the dynamic reverses: AI startups at this level attain significantly lower valuations than non-AI startups. In other words, in the sectors where this dynamic holds, non-AI startups have a much lower valuation floor than AI startups, but they also have a higher ceiling.
Geographical trends
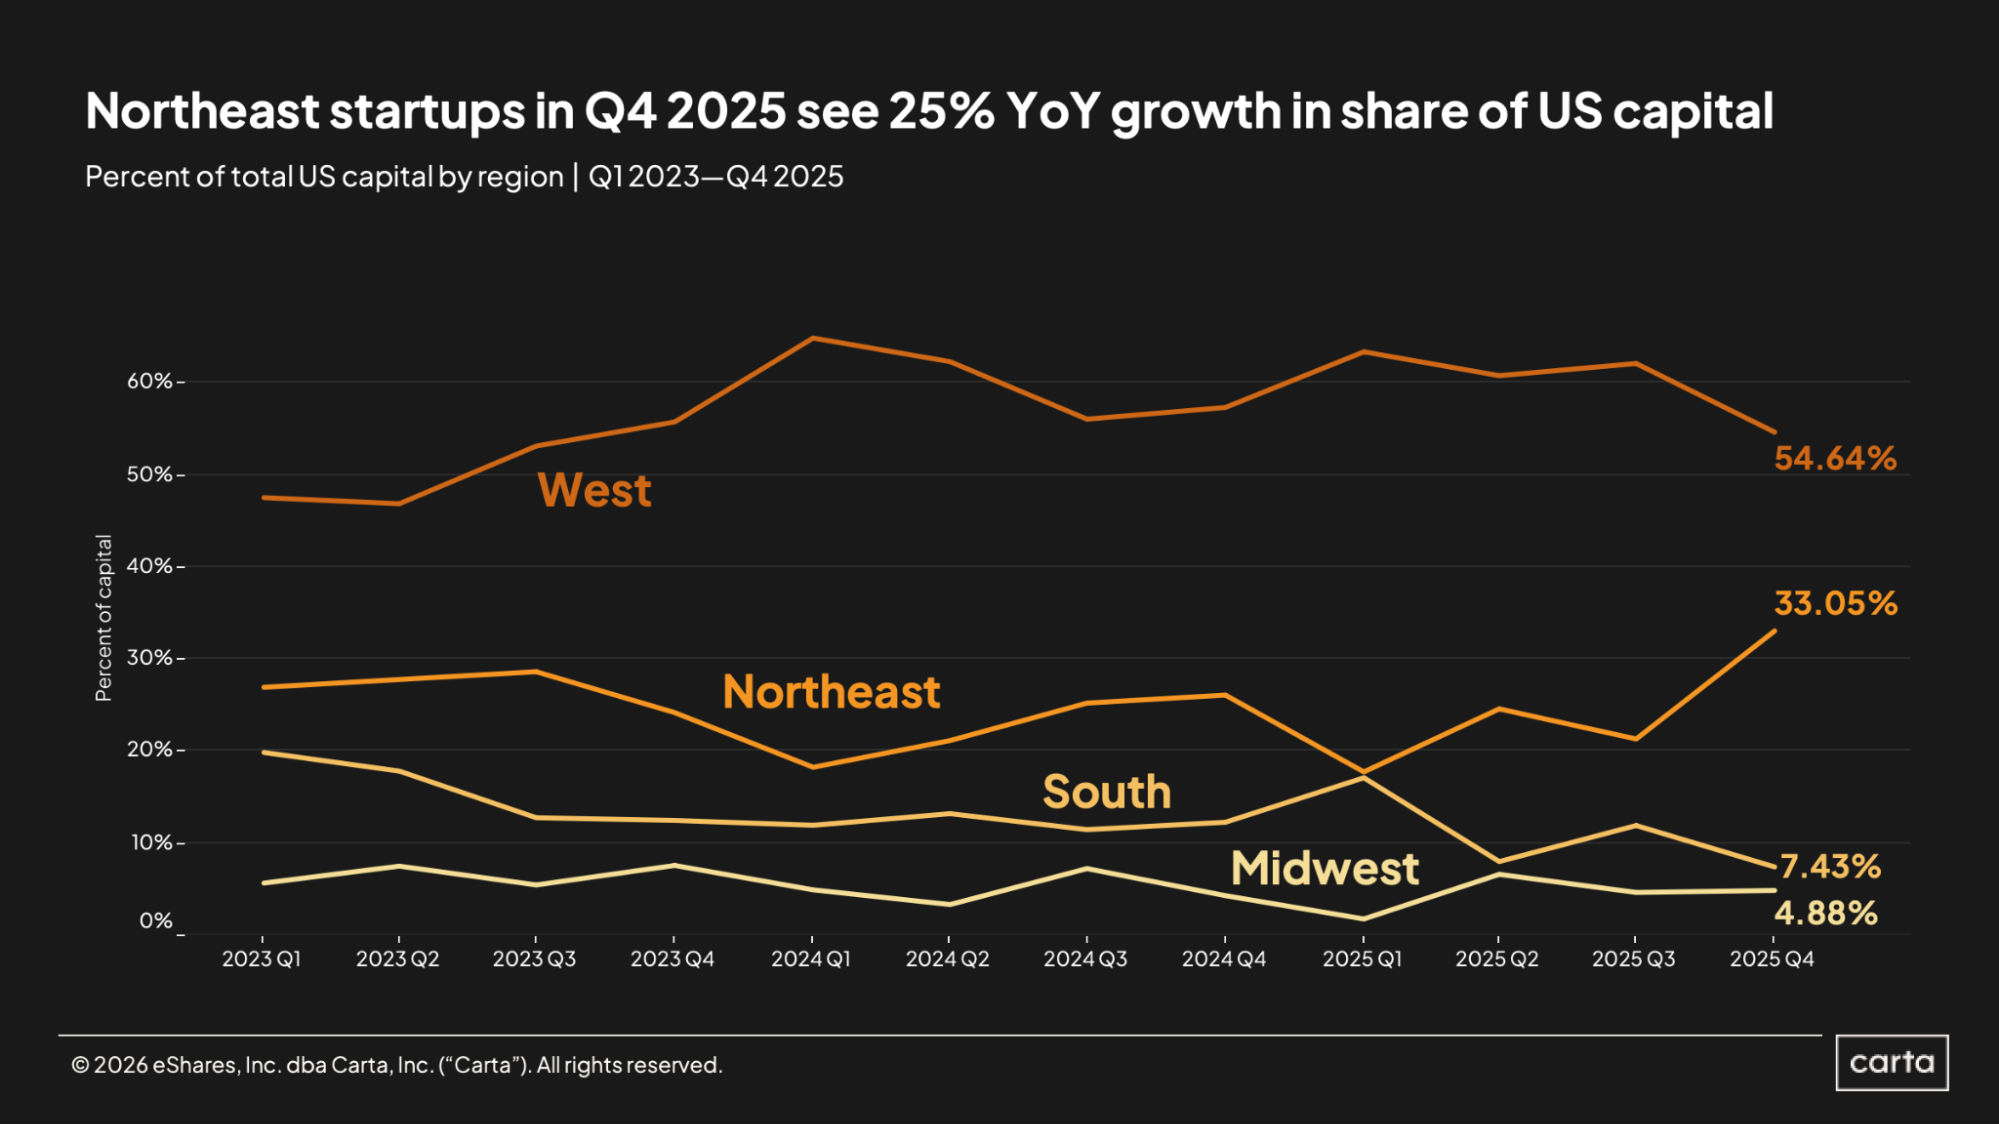
The West census region remained the clear geographic leader for venture capital fundraising in Q4, claiming about 54.6% of all cash raised on Carta. But the West’s market share gradually lessened over the course of last year: Back in Q1, the region claimed 63.6% of all VC funding.
Conversely, the proportion of all venture fundraising that went to startups based in the Northeast rocketed up over the course of 2025, rising from 17.8% back in Q1 to 33.1% in Q4—a near doubling of its market share. The South, meanwhile, has now fallen below a 10% share of all cash raised in two of the past three quarters, after previously landing above 10% in nine consecutive quarters.
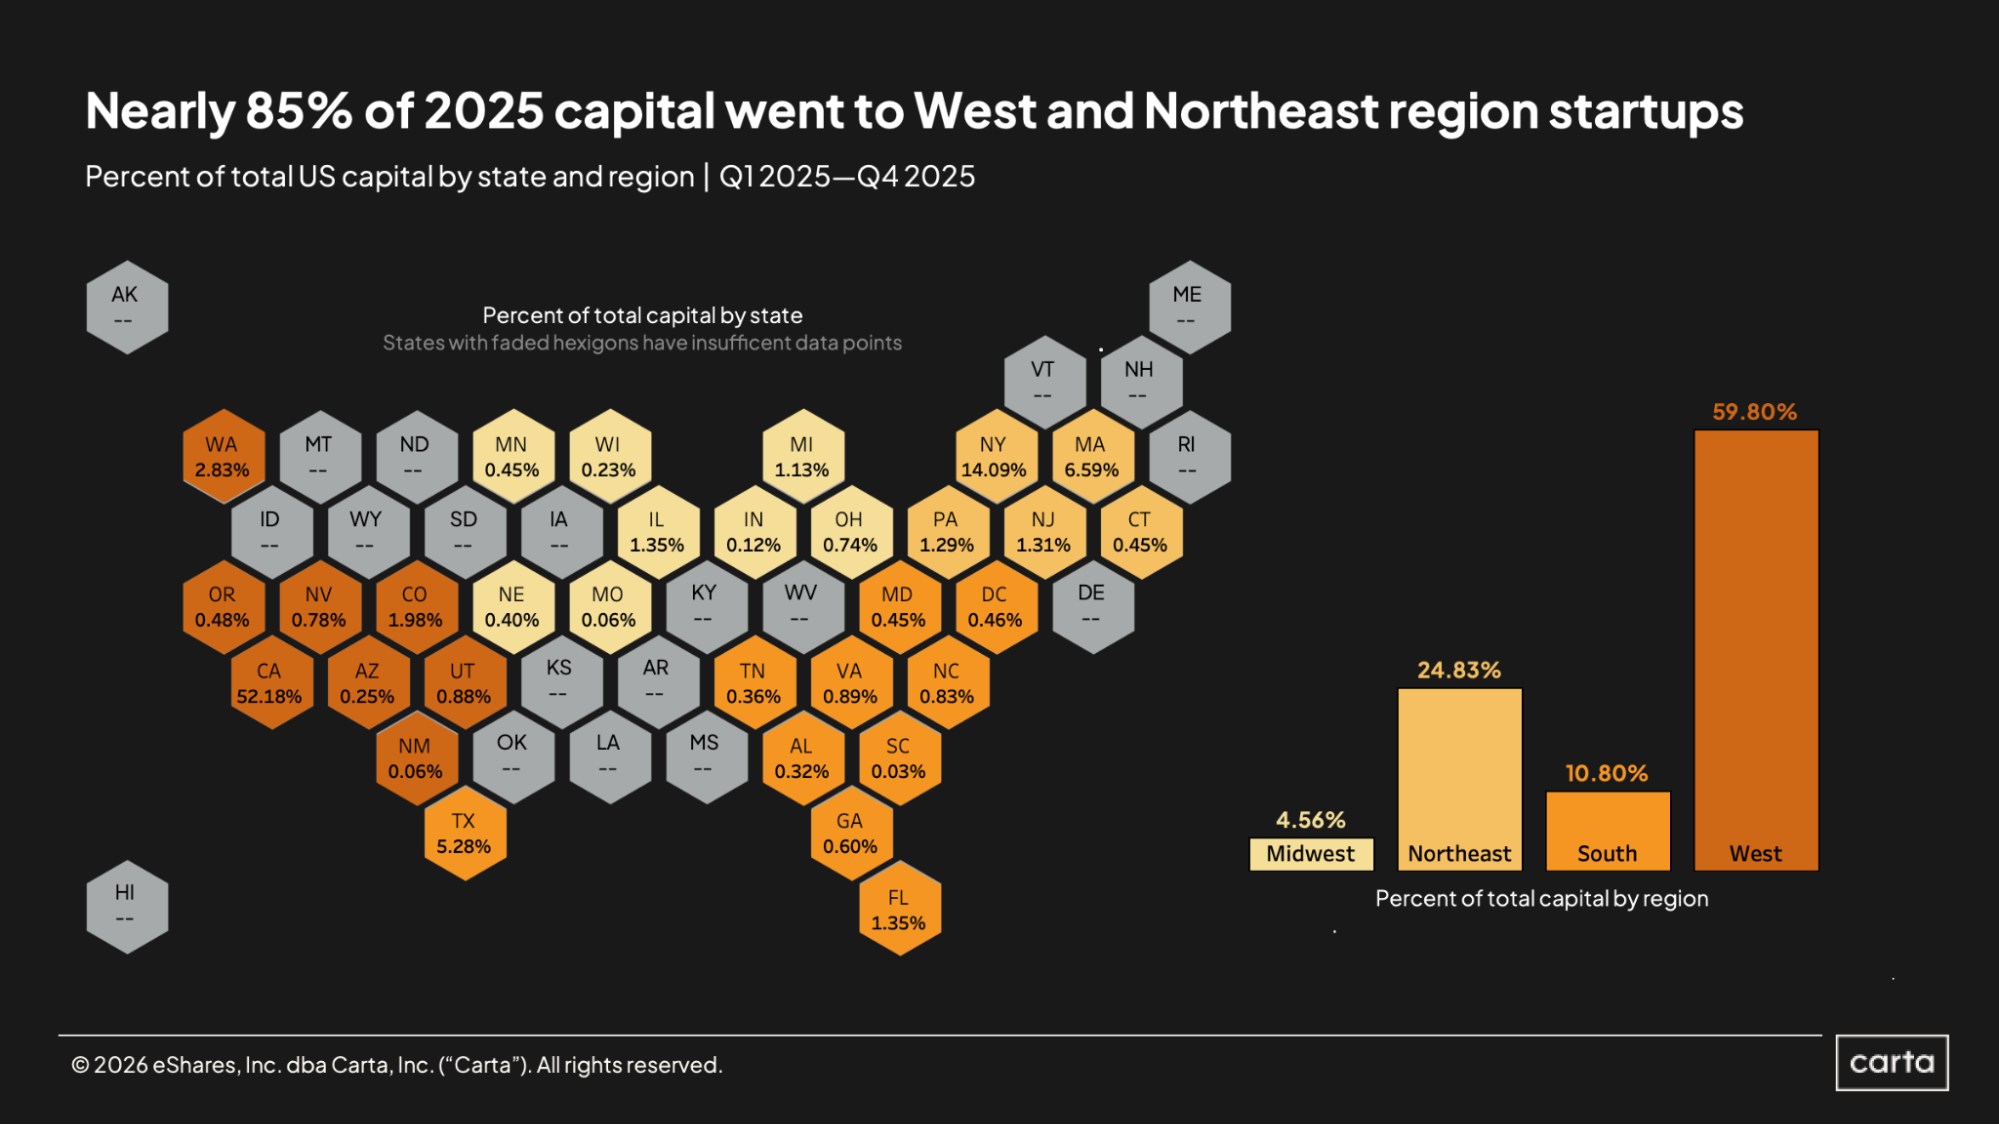
For every dollar that was invested in U.S. startups on Carta last year, nearly 85 cents went to companies based in the West and Northeast census regions. As usual, the concentration of capital in these two regions was led by a few key states. California was home to 52.2% of all funding, while New York claimed 14.1% and Massachusetts another 6.6%. In recent quarters, this gap in funding between New York and Massachusetts has been gradually widening.
After these three states listed above, the next-largest hub for venture funding in the U.S. last year was Texas, with a 5.3% market share. Washington rounds out the top five, at 2.8%. In total, 11 different states each claimed at least 1% of all venture funding raised on Carta in 2025.
Methodology
Carta helps more than 50,000 primarily venture-backed companies who have combined to raise more than $1.2 trillion in equity. We share insights from this unmatched dataset about the private markets and venture ecosystem to help founders, employees, and investors make informed decisions and understand market conditions.
Overview
This study uses an aggregated and anonymized sample of Carta customer data. Companies that have contractually requested that we not use their data in anonymized and aggregated studies are not included in this analysis.
The data presented in this private markets report represents a snapshot as of February 1 , 2026. Historical data may change in future studies because there is typically an administrative lag between the time a transaction took place and when it is recorded in Carta. In addition, new companies signing up for Carta’s services will increase the historical data available for the report.
Financings
Financings include equity deals raised in USD by U.S.-based corporations. The financing “series” (e.g., Series A) is taken from the share class name in their applicable certificate or articles of incorporation. Financing rounds that don’t follow this standard are not included in any data shown by series, but they are included in data not shown by series. Primary rounds are defined as the first equity round within a series. Bridge rounds are defined as any round raised after the first round in a given series.
In some cases, convertible notes are raised and converted at various discounted prices within a series (e.g., Series A-1, Series A-2, Series A-3). In these cases, converted securities are not included in cash raised, and only the post-money valuation of the new money is included.


DISCLOSURE: This communication is on behalf of eShares, Inc. dba Carta, Inc. ("Carta"). This communication is for informational purposes only, and contains general information only. Carta is not, by means of this communication, rendering accounting, business, financial, investment, legal, tax, or other professional advice or services. This publication is not a substitute for such professional advice or services nor should it be used as a basis for any decision or action that may affect your business or interests. Before making any decision or taking any action that may affect your business or interests, you should consult a qualified professional advisor. This communication is not intended as a recommendation, offer or solicitation for the purchase or sale of any security. Carta does not assume any liability for reliance on the information provided herein. ©2026 Carta. All rights reserved. Reproduction prohibited.