
Executive summary
When it comes to value creation, the best-performing venture funds of the past decade are running away from the competition.
In the 2019 vintage, for instance, the 90th percentile for TVPI sat at 3.01x at the end of last year, compared to a 75th percentile TVPI of 1.9x. This gap between the 75th and 90th percentiles of performance is far larger than the gap between the 75th percentile and the median (1.33x) of 2019 funds, or between the median and the 25th percentile (1.02x).
The same sort of right-tailed distribution can be found at every other vintage of venture funds tracked on Carta from 2017 through 2024. In some cases, the outperformance of the upper tier is even more pronounced. In the 2017 vintage, a top-decile TVPI is 4.08x, while a top-quartile mark is 2.53x, and the median is at 1.89x.
These figures reflect a fundamental fact of the VC ecosystem: It’s a top-heavy asset class. A very small number of startups produce truly outsized returns, generating multiples on the scale of 100x or even 1000x. The vast majority of investments result in much smaller returns; many don’t produce any return at all.
Company-level returns then translate to the fund level. Funds that invest in one or two of the asset class’s true outliers will generate lofty multiples and lucrative returns, the type that keep LPs happy for years to come, with the home-run investments easily outweighing any struggles in the rest of the portfolio. These are the funds that populate the top decile of performance.
For the funds that miss out in their hunt for unicorns, returns will inherently be less attractive. But for the recent fund vintages included in this report’s analysis, the ultimate results are far from baked in. The winners have not yet been decided. In the years to come, funds that currently claim middling return profiles may eventually ascend into the upper echelons.
Regardless of where each individual fund ends up, one truth will remain: Venture capital is a game where the winners tend to win very big indeed.
Highlights
IRR turns positive for 2021 & 2022 VC funds: The median net IRRs for both the 2021 and 2022 vintages of venture funds on Carta have climbed out of negative territory, currently sitting at 1.4% for the 2021 vintage and 0.7% for 2022. Traditionally, IRRs for private funds follow a J-curve, falling below zero during the initial period of management and then steadily rising as fund assets gain in value. Each vintage from 2017 through 2020 currently has a net IRR of at least 4.2%.
Dry powder stacks up in recent vintages: Venture funds on Carta in the 2025 fund vintage still have 72% of their total committed capital remaining on hand as dry powder. About 53% of all capital remains unspent in the 2024 vintage, and 35% for the 2023 vintage. Overall, these three most recent vintages combine to claim more than $19 billion in dry powder.
Returns to LPs grow more common: More than half of all funds from the 2020 vintage have begun to generate at least some amount of DPI, with about 15% of those funds returning capital to LPs for the first time during 2025. In the 2021 vintage, about a third of all funds have begun to record DPI; for both the 2022 and 2023 vintages, the rate sits at just under 25%.
Fund details
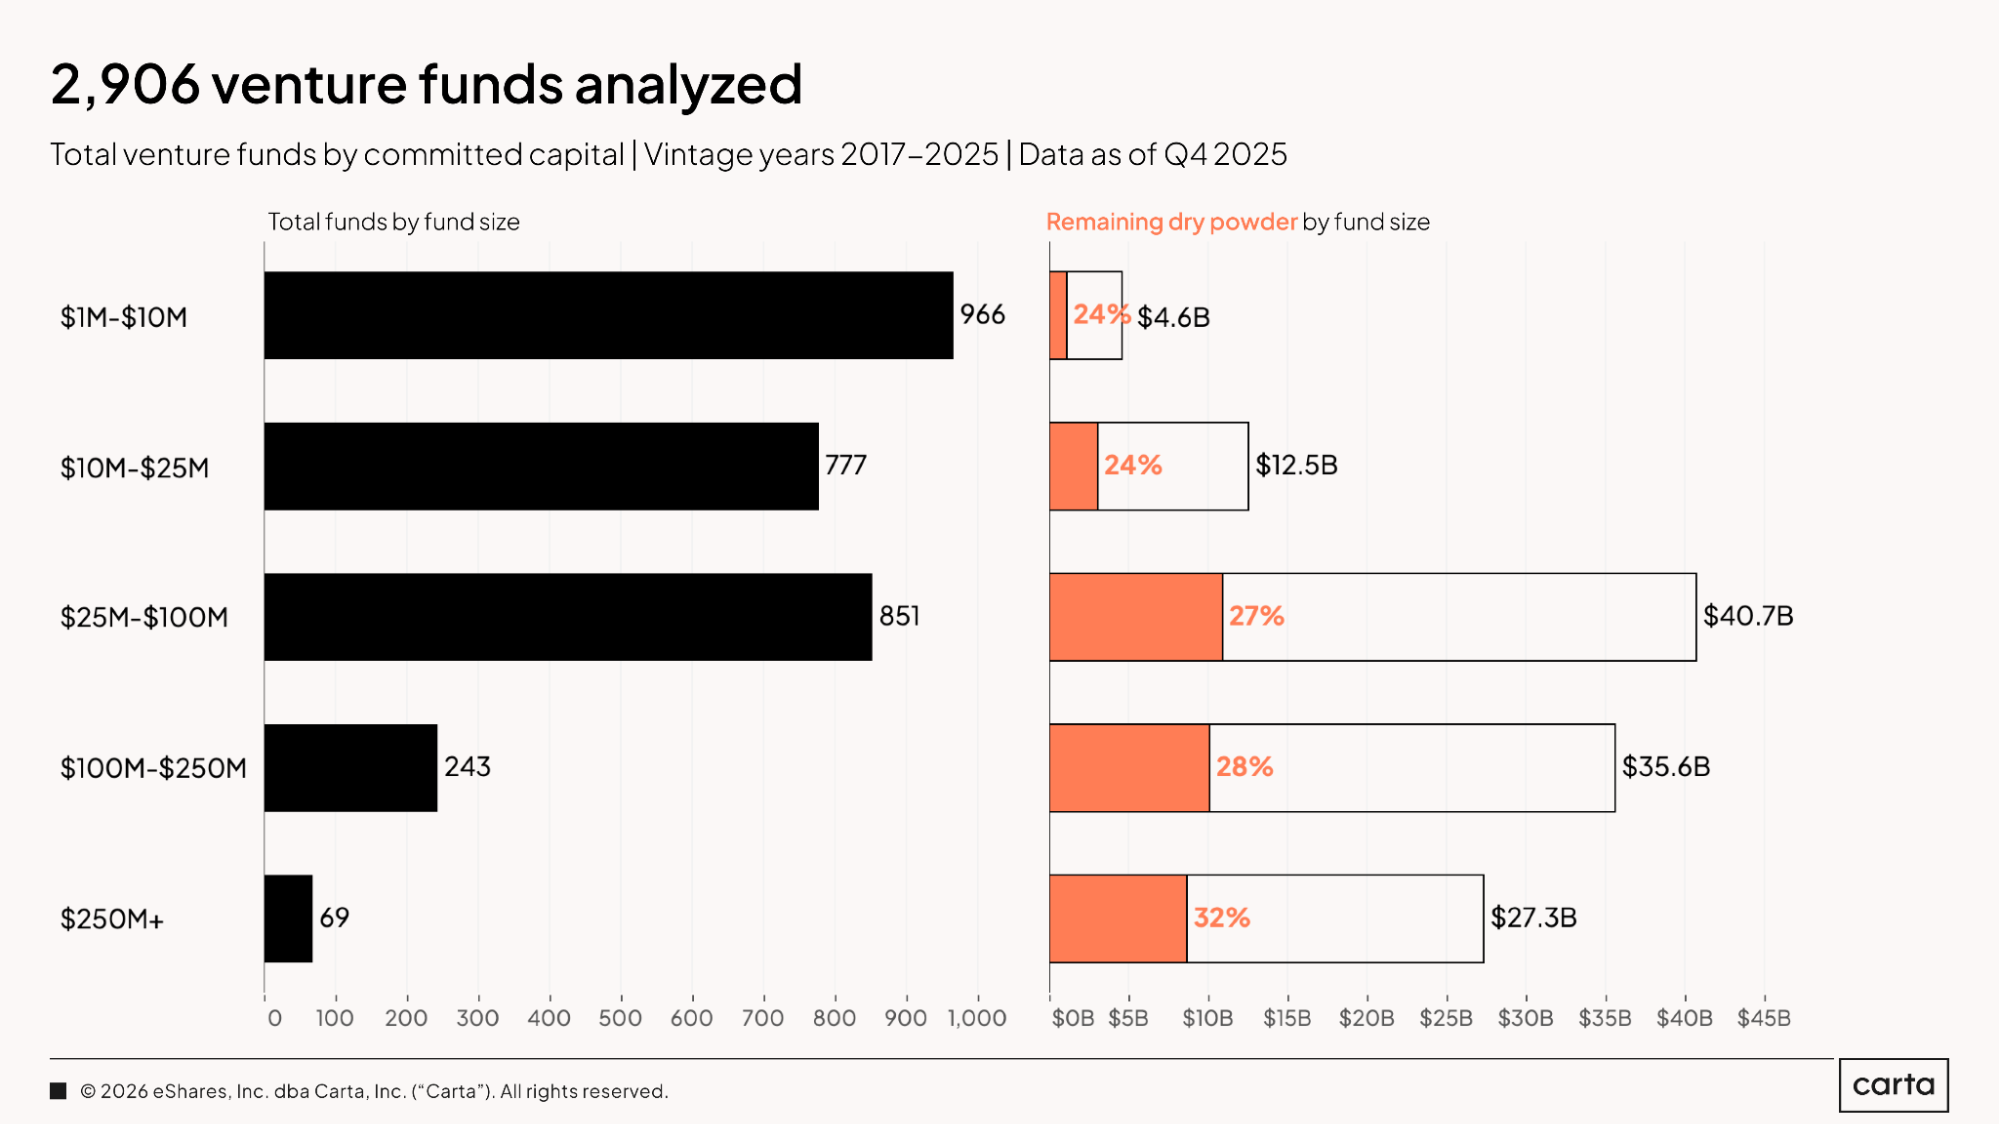
This report relies on data from 2,906 venture funds tracked on Carta from vintage years 2017 through 2025. Most of these funds—about 89%—manage less than $100 million, with a plurality (33%) landing between $1 million and $10 million in size. Across all fund sizes, the funds analyzed in this report boast about $120.7 billion in combined capital under management.
While the $1 million to $10 million cohort claims the largest number of total funds, the group of funds ranging from $25 million to $100 million in size claims the largest share of overall capital, at about $40.7 billion. While just 11% of the total funds in this sample are larger than $100 million, those vehicles combine to account for 52% of all committed capital across this nine-year sample, reflecting the top-heavy nature of the venture fundraising market as a whole.
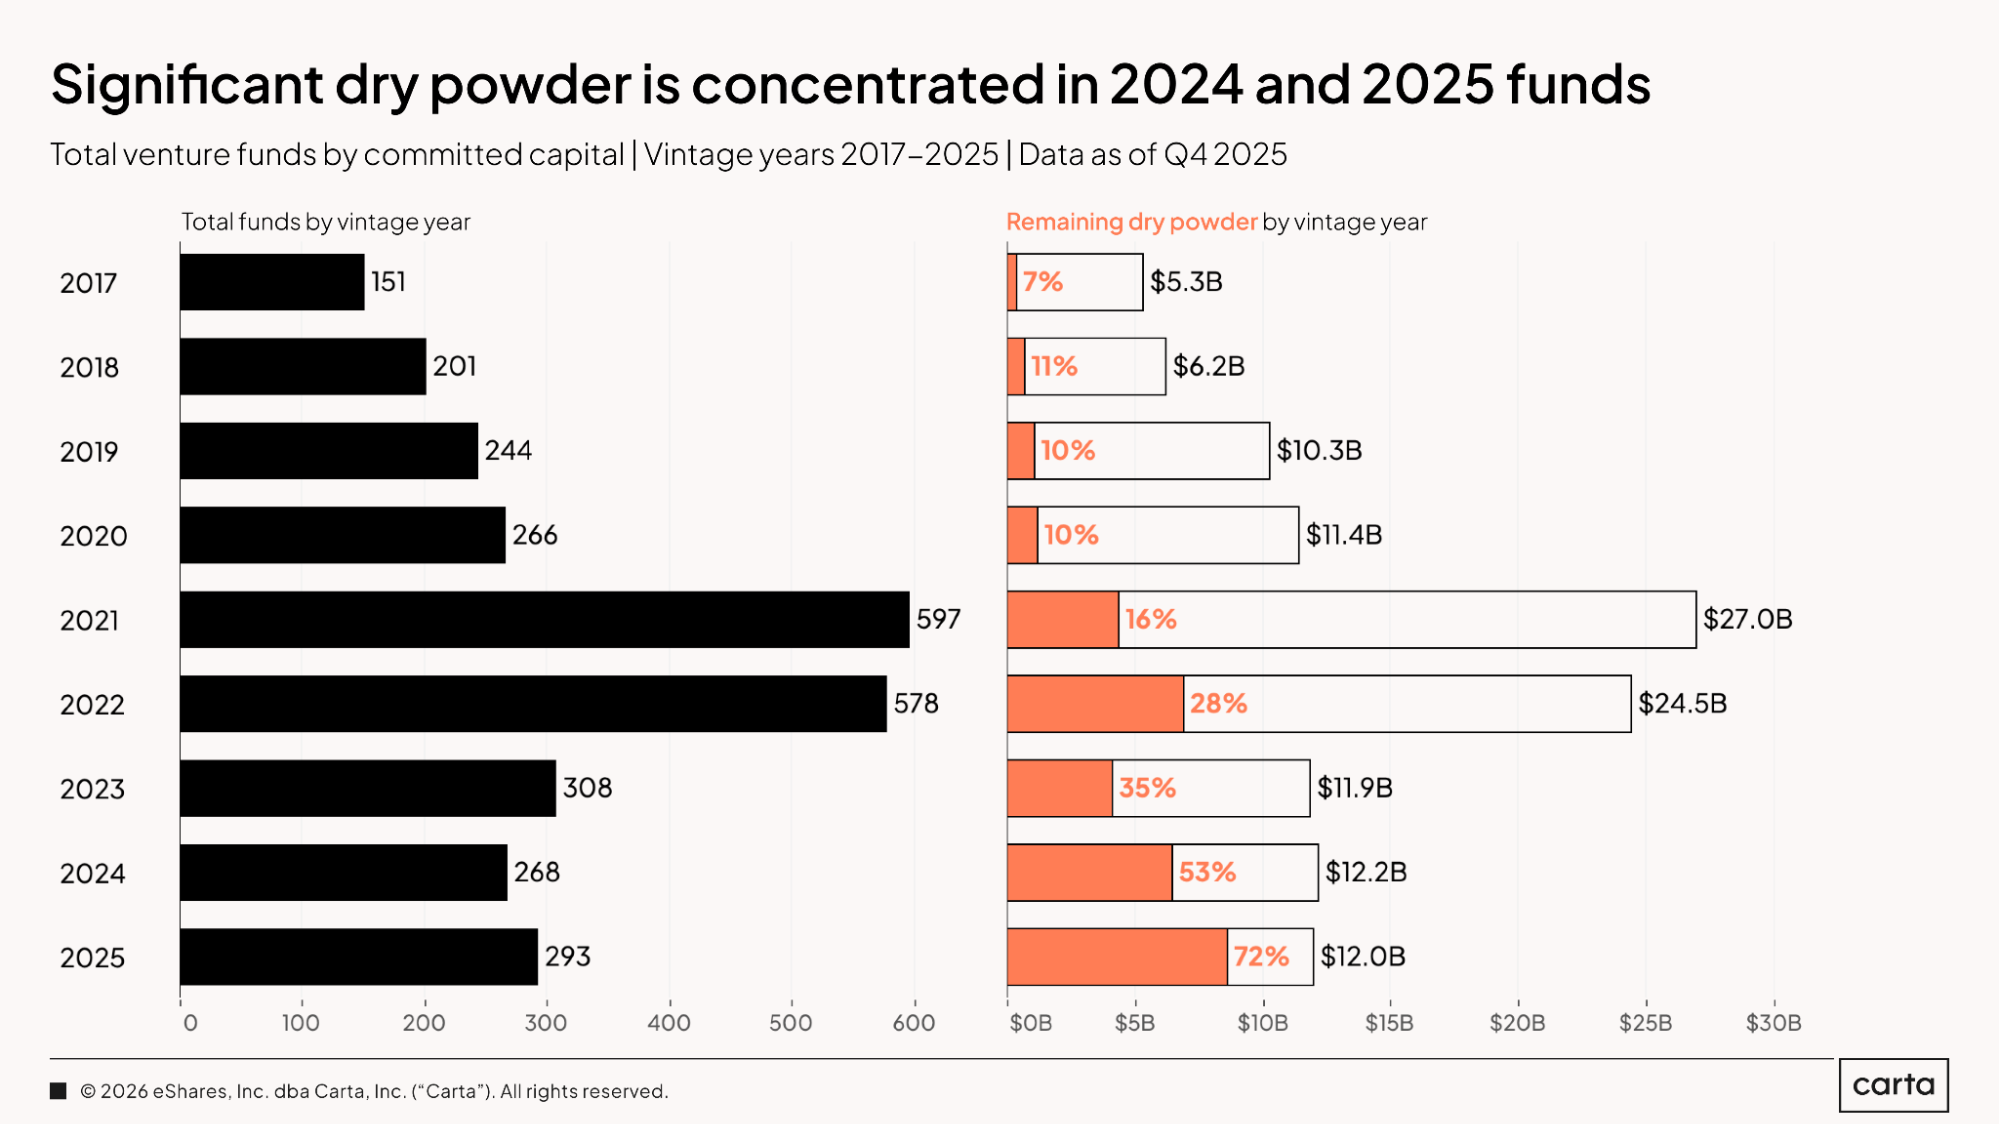
Venture funds on Carta in the 2025 vintage combined to raise $12 billion in total capital. As of the end of last year, about 72% of that cash remained on hand as unspent dry powder. Funds in the 2024 vintage are also still sitting on substantial dry powder reserves, with 53% of total capital commitments still unspent.
As you move further back in time, rates of dry powder rapidly decline. Funds from the 2023 vintage have already deployed about two-thirds of their cash, with 35% remaining as dry powder; in the 2021 vintage, just 16% of the $27 billion in total cash raised remains unspent. Prior to 2021, percentages of dry powder flatten out, with only minor variation in vintages from 2017 through 2020.
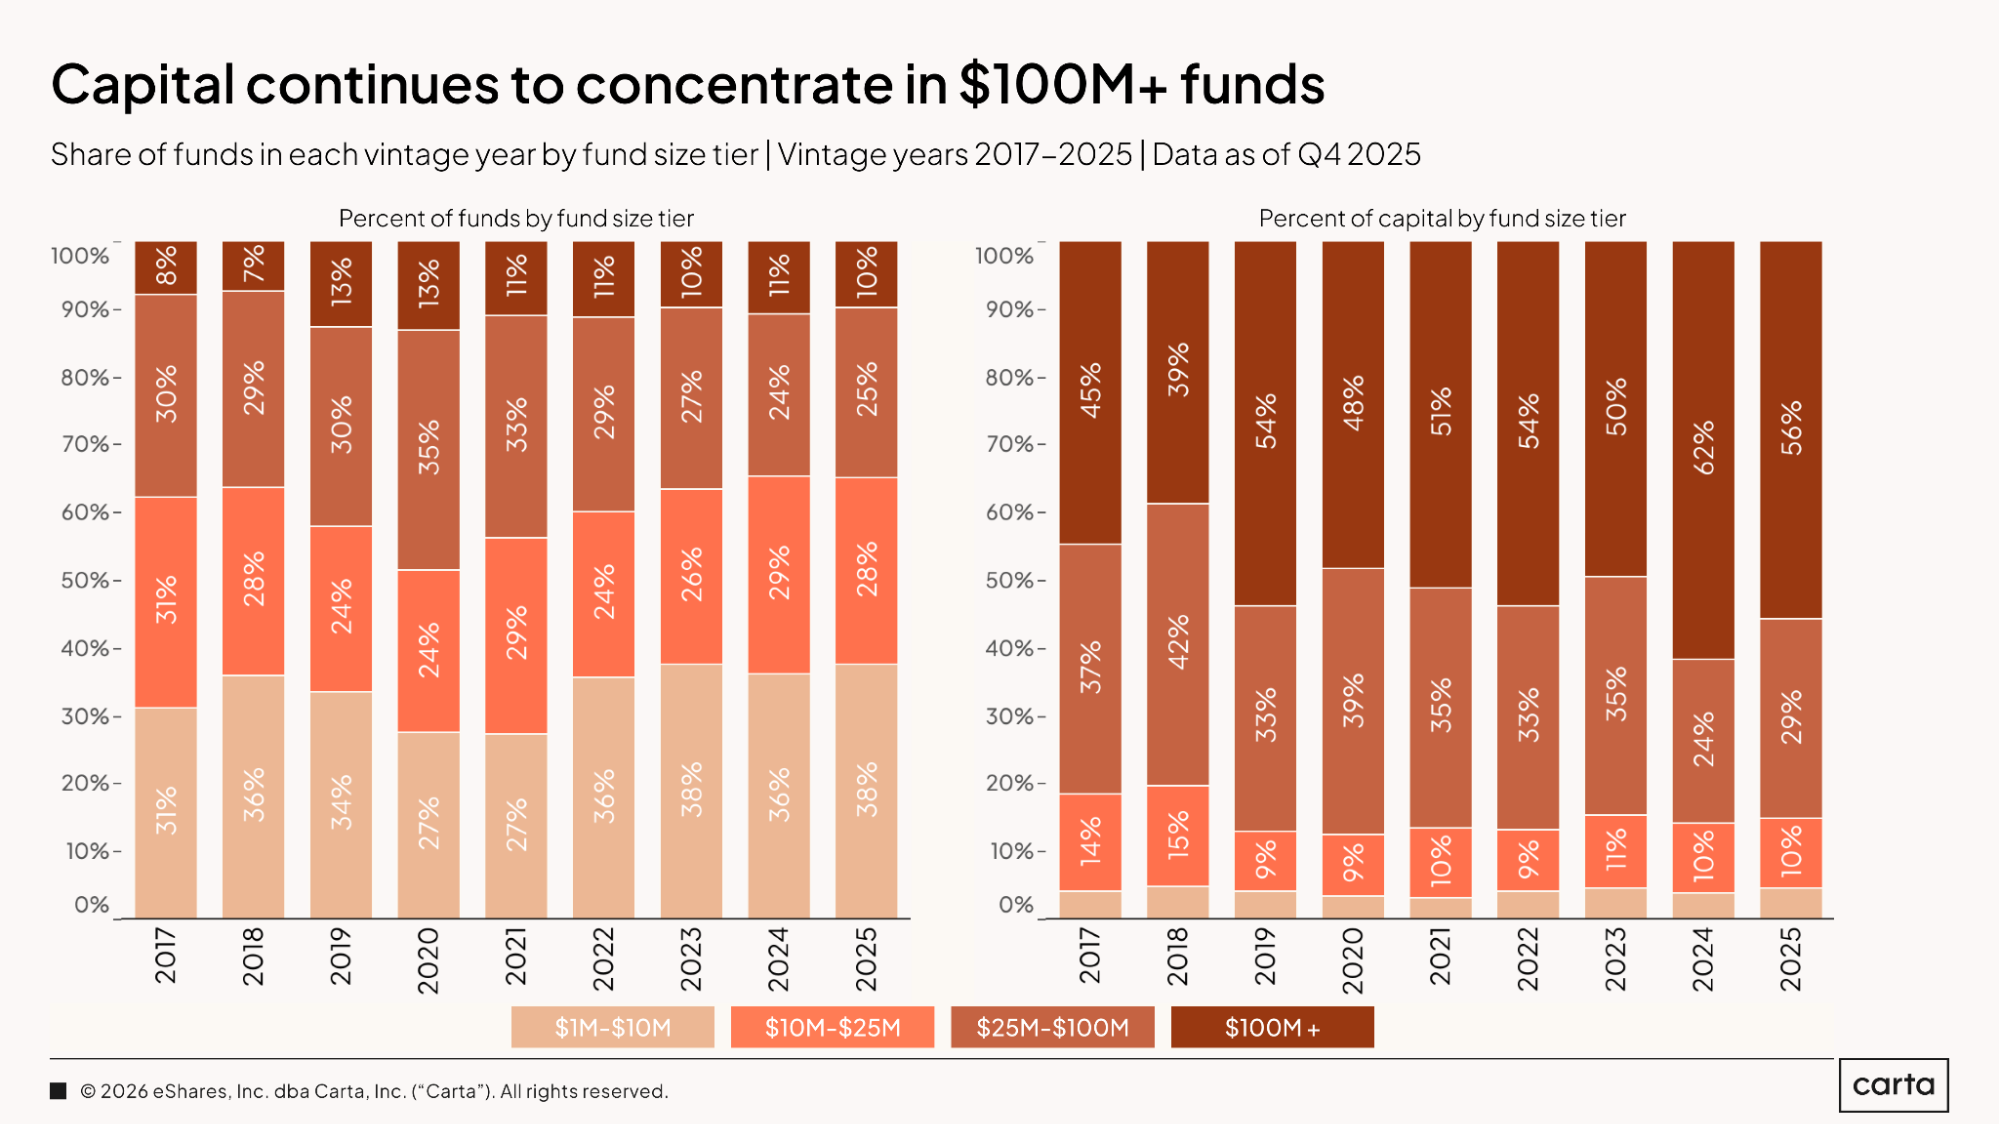
Over the past few years, the division of new venture funds by fund size has remained mostly unchanged. Somewhere between 36% and 38% of new funds raised have been between $1 million and $10 million in size, and either 10% or 11% have been larger than $100 million.
There’s been a little more variation in how total capital is distributed across these cohorts. In 2025, 56% of all cash raised went to funds with more than $100 million in commitments, down from 62% in 2024, which was the highest rate of the past nine years. Funds between $25 million and $100 million, meanwhile, have been playing a reduced role in the venture landscape: This cohort has accounted for less than 30% of capital raised in each of the past two years, after previously landing above 30% for seven years in a row.
Full report available: Start reading now for free
See our complete VC Fund Performance Q3 report, with 25 charts and best-in-class data on fund performance including IRR, TVPI, DPI, and more.


DISCLOSURE: This communication is on behalf of eShares, Inc. dba Carta, Inc. ("Carta"). This communication is for informational purposes only, and contains general information only. Carta is not, by means of this communication, rendering accounting, business, financial, investment, legal, tax, or other professional advice or services. This publication is not a substitute for such professional advice or services nor should it be used as a basis for any decision or action that may affect your business or interests. Before making any decision or taking any action that may affect your business or interests, you should consult a qualified professional advisor. This communication is not intended as a recommendation, offer or solicitation for the purchase or sale of any security. Carta does not assume any liability for reliance on the information provided herein. ©2026 Carta. All rights reserved. Reproduction prohibited.