- J-curve: Definition, drivers and mitigation strategies
- What is the J-curve?
- The three stages of the J-curve
- Stage 1: Capital call period (Years 1-3/4)
- Stage 2: Investment period (Years 4-6)
- Stage 3: Harvesting period (Years 7-10+)
- Factors influencing the J-curve
- Time required for investment maturation
- External market conditions
- Fund manager skill and strategy
- J-curve variations across private equity strategies
- Venture capital
- Growth equity
- Buyout funds
- Implications of the J-curve for investors
- How the J-curve impacts fund performance and reporting
- Modeling the J-curve from construction to exit
- Managing capital calls and cash flow through the trough
- Reporting to LPs with clarity and confidence
- Handling the audit with a fund in the J-curve
- How to mitigate the J-curve effect
- See how an integrated platform addresses the J-curve
- Frequently asked questions about the J-curve
- What does a J-shaped curve on a graph indicate?
- How long does the negative portion of the J-curve typically last?
- How does the J-curve differ for a buyout fund versus a VC fund?
This article explains the private equity J-curve, covering the fund mechanics that create it, its impact on your financial reporting and limited partner (LP) communications, and strategies to manage its effect.
What is the J-curve?
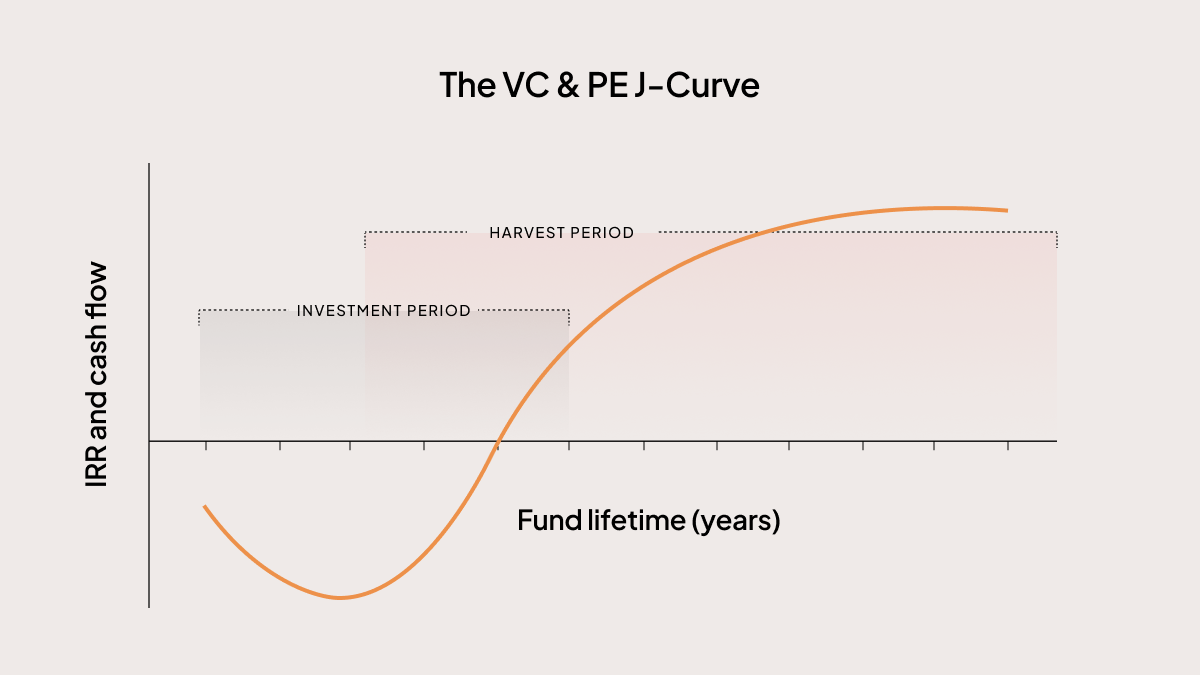
The J-curve is a visual representation of investment returns over time that follows the shape of the letter “J.” It shows an initial period where returns are negative—a dynamic reflected in broader market cycles where exit value plummeted nearly 70% from peak to trough—followed by a period of growth where returns climb, and eventually surpass the starting point. This pattern is a fundamental concept in private fund management, especially in private equity (PE) and venture capital (VC).
The three stages of the J-curve
The J-curve in private equity can be divided into three distinct stages, each characterized by specific activities, financial dynamics, and implications for investors. Understanding these stages is essential for effective portfolio management and reporting.
Stage 1: Capital call period (Years 1-3/4)
The initial phase of a private equity fund, typically spanning the first three to four years, is known as the capital call period. During this stage, investors experience negative returns primarily due to the mechanics of the capital call process and the associated fee structures.
Private equity funds operate by securing capital commitments from investors, and the fund manager draws down this committed capital as suitable investment opportunities are identified. A significant factor contributing to early negative returns is the way management fees are structured, often charged on the total committed capital from the fund's inception, regardless of how much capital has actually been invested.
The fund also incurs other front-loaded expenses such as legal and accounting fees, administrative salaries, and due diligence costs, which further contribute to the initial cash outflow.
Stage 2: Investment period (Years 4-6)
The second stage, typically occurring around years four to six of the fund's life, is the investment period. In this phase, the portfolio companies acquired by the fund begin to mature and grow in value, leading to unrealized gains for the fund and its investors. The fund manager plays an active role in implementing strategies aimed at enhancing the value of these companies through operational, financial, and managerial improvements.
While significant returns aren’t yet fully realized, some early exits of portfolio companies or distributions of capital may occur, beginning to moderate the negative performance trend observed in the initial years. It's important to understand that private companies are often valued on a quarterly basis. Unrealized gains, which represent the increase in value of these investments, are therefore reflected in the fund's reported performance with a time lag.
Stage 3: Harvesting period (Years 7-10+)
The final stage, the harvesting period, generally spans from year seven to ten and beyond. This is the period when the private equity firm focuses on exiting its investments in portfolio companies through various means such as sales, buyouts, or IPOs.
These exits generate substantial positive cash flows for the fund, driving the steep upward trajectory of the J-curve. Capital is returned to the investors, often significantly exceeding their initial contributions. As the majority of the portfolio companies are exited and the gains are distributed, the J-curve typically begins to flatten out, signaling the fund is approaching the end of its lifecycle.
The timing and success of these exit events are key determinants of the magnitude and speed of the positive private equity returns observed in the J-curve. Managing and organizing exit-related documents becomes vital during this phase, and AI-powered automated document management can help streamline these critical workflows.
Factors influencing the J-curve
The shape and trajectory of the J-curve in private equity are influenced by a complex interplay of various factors. Understanding these factors is crucial for fund management and for investors seeking to navigate the intricacies of this asset class.
Time required for investment maturation
The inherent time required for private equity investments to mature and generate substantial returns is a critical factor shaping the J-curve. This includes the period for capital deployment, implementing strategic changes within portfolio companies, achieving revenue growth, and ultimately executing a profitable exit. The illiquid nature of private equity requires a long-term investment strategy, as returns are not realized immediately.
External market conditions
The current state of the market, including macroeconomic trends, sector-specific dynamics, and overall market volatility, can significantly influence the performance of portfolio companies and the timing of successful exits. Economic expansions can accelerate the improvement of portfolio companies, while economic downturns might prolong the period of negative returns, introducing market volatility that must be considered in any private equity investment strategy.
Fund manager skill and strategy
The fund manager is critical in shaping the J-curve's trajectory. Their ability to identify promising investment opportunities, effectively manage and enhance the value of portfolio companies, and execute successful exits are crucial in determining the fund's overall success. Different investment strategies within private equity, such as venture capital, growth equity, and buyouts, naturally exhibit variations in their expected J-curve profiles, underlining the importance of a well-defined investment strategy.
J-curve variations across private equity strategies
While the J-curve is a common phenomenon in private equity, its specific characteristics can vary considerably depending on the underlying investment strategy. Understanding these variations is crucial for investors seeking to align their investment expectations with the nuances of different private equity approaches.
Venture capital
Venture capital investments typically exhibit a pronounced and extended J-curve. This is due to the inherent high initial risks associated with investing in early-stage companies and the longer development periods required for these companies to achieve significant growth and profitability.
The harvesting period for VC can also be prolonged, as successful exits often rely on events like IPOs or major acquisitions, which may take many years to materialize. Investors in VC should therefore anticipate a more significant initial dip and a potentially longer timeframe before realizing substantial positive returns.
Growth equity
Growth equity investments often present a moderate J-curve. These investments focus on more established companies seeking capital for expansion, which typically have existing market positions and revenue streams. This can lead to a faster path to profitability and positive returns compared to VC-backed startups.
The investment horizon for growth equity might also be shorter, with exits occurring as these companies achieve further scale or are acquired. Investors in growth equity can generally expect a less severe and potentially shorter J-curve than in VC.
Buyout funds
Buyout funds can experience a deeper initial dip in the J-curve. This is often due to the significant capital deployed for the acquisition of established companies and potential costs associated with restructuring the acquired business. Buyout funds frequently involve leveraged acquisitions, where a substantial portion of the purchase price is financed with debt.
The initial focus may be on repaying this debt, which can impact early returns. However, successful operational improvements, cost reductions, and strategic initiatives implemented by the buyout firm can lead to substantial increases in the value of the acquired companies, driving strong returns upon exit. Buyout funds may therefore present a deeper initial J-curve, but successful value creation can result in a steeper and more rewarding upward curve in the later stages.
Implications of the J-curve for investors
The J-curve has significant implications for investors in PE, shaping their expectations, investment strategies, and cash flow management. A thorough understanding of these implications is crucial for navigating this asset class successfully.
Return expectations: Investors should anticipate a period of negative or low returns during the initial years of their investment, as positive returns are typically realized in the later stages of the fund's life.
Long-term investment perspective: Investors must be ready to commit capital for an extended period, allowing for the maturation of portfolio companies and the eventual realization of returns.
Cash flow dynamics: The J-curve dictates a distinct cash flow pattern for investors. Effective cash flow management is crucial for investors to plan for this initial outflow and subsequent inflow.
Illiquidity: Private equity investments are generally illiquid, particularly in the early years. This emphasizes the need for a long-term commitment and careful consideration of an investor's overall portfolio and liquidity needs.
Comparative framework: Experienced investors often use the J-curve as a framework to compare the performance of different funds and to evaluate the strategies employed by various fund managers.
Investor education: Educating investors about the J-curve is crucial for managing their expectations and ensuring their continued commitment to their long-term private equity allocations. Accurate reporting and data visibility are essential for this education process.
How the J-curve impacts fund performance and reporting
The J-curve creates a set of unique operational and strategic challenges that fall directly to a fund CFO. It influences every aspect of the job, from financial modeling and fund forecasting to cash management, LP communications, and preparing for the annual fund audit. Successfully managing these responsibilities requires moving beyond manual spreadsheets and disconnected systems.
An integrated, modern approach is needed to handle the complexities the J-curve introduces into a fund CFO’s daily work and strategic planning.
Modeling the J-curve from construction to exit
One of the most common frustrations for fund managers is relying on static spreadsheets for financial modeling. These tools are not built to handle the dynamic nature of a fund. They can't easily forecast the trajectory of the J-curve, model complex scenarios like follow-on investments, or help you plan for future liquidity needs.
A modern approach involves dynamic modeling tools that are purpose-built for fund management. These tools connect directly to your fund's live financial data, allowing you to model portfolio construction, forecast performance, and plan for capital reserves with much greater accuracy. This shifts your role from reactive reporting to proactive strategic advising, helping the GPs make better decisions about investment pacing and when to begin planning for the next fund.
Managing capital calls and cash flow through the trough
The operational burden of managing capital calls manually can be immense, especially when your fund is in the J-curve's trough and cash flow is tight. Tracking LP responses in a spreadsheet, manually reconciling wire transfers, and sending individual reminders is not only inefficient but also creates a high risk of error. A mistake in a capital call notice can damage an LP relationship and cause funding delays at a critical moment.
Integrated platforms with built-in capital call workflows, distributions management, and treasury functions remove this operational risk. They automate the process of sending notices, provide LPs with a secure portal to view their obligations, and connect directly with your bank accounts to streamline reconciliation. This gives you real-time visibility into your fund's cash position and frees up your time to focus on more strategic work.
Reporting to LPs with clarity and confidence
Communicating a fund's performance using the right fund performance metrics during the J-curve period is one of the most essential parts of your job. Your LPs are sophisticated investors who understand the J-curve model, but they need clear, timely, and transparent reporting to maintain their confidence. It's not just about sending a quarterly report; it's about telling the story of the fund's progress.
During these early years, certain metrics are more meaningful than others. For example, distributions to paid-in capital (DPI) will be zero, so the focus is on total value to paid-in capital (TVPI), a type of multiple on invested capital (MOIC), and internal rate of return (IRR).
A centralized LP portal is the best way to deliver this information. It's more than just a document library; it's an interactive dashboard where LPs can see their personal performance data and access all relevant documents in one place. This level of transparency reduces the number of one-off questions you receive and builds a foundation of trust that will last for the life of the fund.
Handling the audit with a fund in the J-curve
The annual audit is a high-stakes event for any fund, but the scrutiny is particularly intense for a fund in its early years. Auditors will meticulously verify every management fee calculation, confirm that capital calls align with the limited partnership agreement (LPA) created during fund formation, and challenge the private equity valuations of your unrealized investments. Preparing for your next round can be a painful, drawn-out process. With the average time between a series A and series B now stretching to 893 days, you could spend weeks of your team's time pulling documents and providing support for every number just to get the deal done.
An integrated, event-based fund administration software makes you audit-ready from day one. Every transaction is automatically recorded and linked to its supporting documentation, creating an immutable audit trail that dramatically speeds up the audit process.
How to mitigate the J-curve effect
While the J-curve is an inherent part of the private equity model, there are several strategies you can employ to lessen its depth and duration. These approaches can help smooth out a fund's return profile, improve its performance metrics in the early years, and potentially provide earlier distributions to your LPs. As a fund professional, you can use these strategies to build a more resilient and attractive fund.
Secondary investments
How it works: This involves acquiring interests in either more mature, existing private equity funds or individual private companies from other investors.
Impact on the J-curve: Secondary investments help flatten the J-curve by providing earlier cash flows and distributions, which is particularly valuable when traditional exit routes like IPOs are slow. As investors seek liquidity, the secondary market offers a viable pathway.
Co-investments
How it works: This allows your LPs to invest directly into a portfolio company alongside the main fund, often with reduced or no management fees on the co-invested capital.
Impact on the J-curve: This approach reduces the overall fee drag on a specific deal. By lowering the initial costs, it improves the net return profile of that investment and lessens the initial dip of the J-curve.
Capital call line of credit
How it works: This is a short-term loan facility that you can use to bridge the timing gap between when you need to fund an investment and when the capital from LPs arrives.
Impact on the J-curve: This tool smooths out cash flow and allows you to close deals more quickly. By accelerating the deployment of capital into investments, it can potentially shorten the time it takes to begin creating value.
Portfolio construction
How it works: Portfolio construction is a strategic decision made during fund formation about how to diversify the fund's portfolio across different company stages, industries, or geographies.
Impact on the J-curve: This strategy, a key part of portfolio management, helps balance the return profiles of your different investments.
See how an integrated platform addresses the J-curve
The J-curve's challenges, from complex financial modeling to transparent LP reporting, can't be managed with manual spreadsheets. A purpose-built platform is the only way for you to gain real-time visibility and control over your fund's entire lifecycle.
Ready to automate your back office and focus on more strategic work? Schedule your demo of Carta fund administration software today.

Frequently asked questions about the J-curve
What does a J-shaped curve on a graph indicate?
A J-shaped curve on a graph indicates a pattern where an initial period of negative results gives way to a period of significant growth that rises above the original starting point. In finance, it represents the typical performance lifecycle of long-term, illiquid investments like private equity funds.
How long does the negative portion of the J-curve typically last?
The negative-return portion of a private equity J-curve, often called the trough, typically lasts for three to five years as initial investments and management fees temporarily outweigh returns. This timeline is reflected in the performance of recent fund vintages, where a majority of funds take years to begin generating positive cash flow for investors. According to a 2024 Carta analysis, more than 60% of VC funds from the 2019 vintage had not yet distributed any capital back to their LPs after five years.
How does the J-curve differ for a buyout fund versus a VC fund?
A buyout fund's J-curve is often shallower and shorter. In contrast, the J-curve for a VC fund is typically deeper and longer, reflecting the time it takes for early-stage companies to mature. This extended timeline means returns can remain negative for years; for the 2021 VC fund vintage, the median IRR was still negative three years after its inception. This long road to liquidity is also evident in cash distributions, as half of all VC funds from the 2018 vintage had not distributed any capital back to their investors as of early 2025.

DISCLOSURE: This communication is on behalf of eShares, Inc. dba Carta, Inc. ("Carta"). This communication is for informational purposes only, and contains general information only. Carta is not, by means of this communication, rendering accounting, business, financial, investment, legal, tax, or other professional advice or services. This publication is not a substitute for such professional advice or services nor should it be used as a basis for any decision or action that may affect your business or interests. Before making any decision or taking any action that may affect your business or interests, you should consult a qualified professional advisor. This communication is not intended as a recommendation, offer or solicitation for the purchase or sale of any security. Carta does not assume any liability for reliance on the information provided herein. ©2026 Carta. All rights reserved. Reproduction prohibited.